OPEN-SOURCE SCRIPT
DCI
### 📌 **DCI – Direction Correlation Index**
#### 🔹 **What It Is**
The **Direction Correlation Index (DCI)** is a tool for measuring how closely a group of up to 10 symbols move together in both *trend correlation* and *short-term direction*. It helps identify whether a group of assets is acting in unison or moving independently.
---
#### ⚙️ **How It Works**
DCI outputs three key metrics:
1. **Average Correlation**
* Measures the average of all pairwise correlations between the selected symbols.
* Prices are first standardized using a z-score (based on simple moving average and standard deviation over a -defined lookback period).
* Correlation is calculated using Pearson’s method for all 45 symbol pairs.
* Result ranges from:
* `+1.00` = strong positive correlation
* `0.00` = no correlation
* `-1.00` = strong inverse correlation
2. **Direction Agreement %**
* Checks whether each symbol is moving up or down compared to its previous bar.
* Calculates the percentage of symbols moving in the same direction.
* For example: if 7 of 10 symbols are moving up and 3 are moving down, the direction agreement is 70%.
3. **Strong Correlation Count**
* Counts how many of the 45 symbol pairs have an absolute correlation above `0.7`.
* Helps highlight how many pairs are currently highly correlated.
---
#### 📈 **How to Use It**
1. **Select Symbols**
* In the **Settings**, you can input up to 10 custom symbols. These can be stocks, indices, forex pairs, crypto, or any tradable asset.
2. **Adjust the Lookback Period**
* Defines how many bars back are used to calculate z-scores and correlations.
* Default is `12`. Use shorter periods for faster response; longer periods for smoother, slower data.
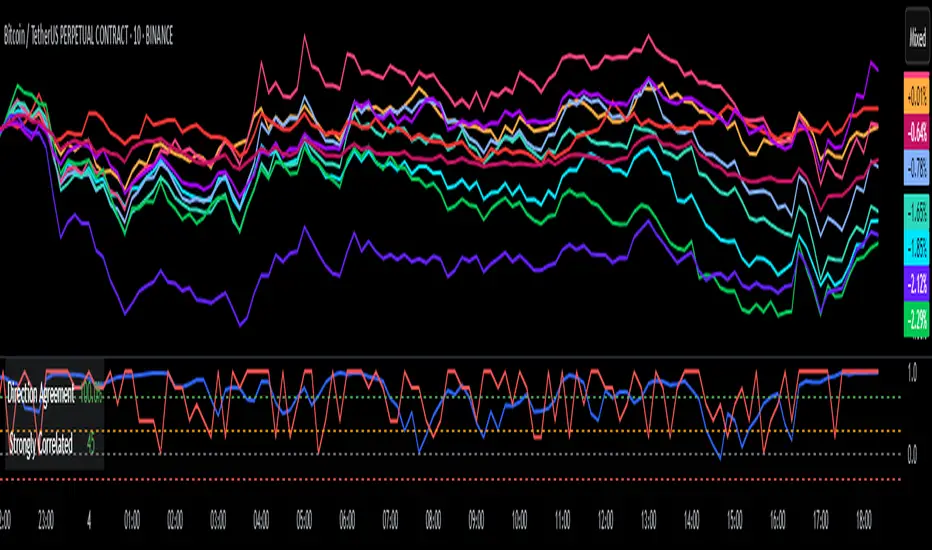
3. **Interpret the Table (Plotted on Chart)**
* **Avg Corr**: Tells you how much the group is co-moving. High correlation often reflects unified market behavior.
* **Dir Agr %**: Shows directional sync. High values mean most instruments are trending the same way in the current bar.
* **> 0.7**: The number of pairs currently strongly correlated (|corr| > 0.7).
---
#### 🧠 **Practical Usage Tips**
* Use DCI to monitor **sector alignment**, **portfolio behavior**, or **market group momentum**.
* Confirm trend strength by checking if high correlation aligns with a strong direction agreement.
* Low correlation + mixed direction can signal **choppy or indecisive markets**.
* High correlation + strong direction = **trend confirmation** across your selected instruments.
- Made with DeepSeek
#### 🔹 **What It Is**
The **Direction Correlation Index (DCI)** is a tool for measuring how closely a group of up to 10 symbols move together in both *trend correlation* and *short-term direction*. It helps identify whether a group of assets is acting in unison or moving independently.
---
#### ⚙️ **How It Works**
DCI outputs three key metrics:
1. **Average Correlation**
* Measures the average of all pairwise correlations between the selected symbols.
* Prices are first standardized using a z-score (based on simple moving average and standard deviation over a -defined lookback period).
* Correlation is calculated using Pearson’s method for all 45 symbol pairs.
* Result ranges from:
* `+1.00` = strong positive correlation
* `0.00` = no correlation
* `-1.00` = strong inverse correlation
2. **Direction Agreement %**
* Checks whether each symbol is moving up or down compared to its previous bar.
* Calculates the percentage of symbols moving in the same direction.
* For example: if 7 of 10 symbols are moving up and 3 are moving down, the direction agreement is 70%.
3. **Strong Correlation Count**
* Counts how many of the 45 symbol pairs have an absolute correlation above `0.7`.
* Helps highlight how many pairs are currently highly correlated.
---
#### 📈 **How to Use It**
1. **Select Symbols**
* In the **Settings**, you can input up to 10 custom symbols. These can be stocks, indices, forex pairs, crypto, or any tradable asset.
2. **Adjust the Lookback Period**
* Defines how many bars back are used to calculate z-scores and correlations.
* Default is `12`. Use shorter periods for faster response; longer periods for smoother, slower data.
3. **Interpret the Table (Plotted on Chart)**
* **Avg Corr**: Tells you how much the group is co-moving. High correlation often reflects unified market behavior.
* **Dir Agr %**: Shows directional sync. High values mean most instruments are trending the same way in the current bar.
* **> 0.7**: The number of pairs currently strongly correlated (|corr| > 0.7).
---
#### 🧠 **Practical Usage Tips**
* Use DCI to monitor **sector alignment**, **portfolio behavior**, or **market group momentum**.
* Confirm trend strength by checking if high correlation aligns with a strong direction agreement.
* Low correlation + mixed direction can signal **choppy or indecisive markets**.
* High correlation + strong direction = **trend confirmation** across your selected instruments.
- Made with DeepSeek
Script de código abierto
Siguiendo fielmente el espíritu de TradingView, el creador de este script lo ha publicado en código abierto, permitiendo que otros traders puedan revisar y verificar su funcionalidad. ¡Enhorabuena al autor! Puede utilizarlo de forma gratuita, pero tenga en cuenta que la publicación de este código está sujeta a nuestras Normas internas.
Exención de responsabilidad
La información y las publicaciones que ofrecemos, no implican ni constituyen un asesoramiento financiero, ni de inversión, trading o cualquier otro tipo de consejo o recomendación emitida o respaldada por TradingView. Puede obtener información adicional en las Condiciones de uso.