SMA-Trend Box + Price-Status Box [BullishBearVentures]Combination of current trend and price status displayed in text boxes. The price status indicates if current price is in-range, overbought, or oversold.
Indicadores y estrategias

Trading SessionsThis indicator is designed to visually separate and highlight different trading sessions (such as Asian, European, and New York sessions) directly on your TradingView chart. By adding vertical lines or shaded background zones, it helps traders quickly identify session boundaries, enabling better analysis of market behavior during specific times of the day.
Key Features:
Clear visual division between trading sessions
Customizable session time ranges
Optional color coding for each session
s multiple timeframes
Purpose:
The primary goal of this indicator is to provide a clear distinction between global trading sessions. This allows traders to:
Recognize session overlaps where volatility tends to spike
Analyze session-specific price action patterns
Strategically align entries and exits with active trading periods
Ideal for day traders and scalpers who rely on time-sensitive strategies, this tool adds clarity and context to intraday charts.

Sri_Auto Fibonacci Sri_Auto Fibonacci is an advanced and original implementation of an automatic Fibonacci retracement plotting tool that uses price action pivots and volatility to dynamically draw key Fibonacci levels. Unlike static manual fib drawing, this tool automates the process by reacting to market structure using pivot detection logic and ATR-based deviation confirmation.
📐 What It Does
Detects major high/low pivot swings on a -selected higher timeframe (default: Daily).
Uses ATR-based deviation threshold to avoid minor or noisy swings.
Automatically plots Fibonacci retracement levels (0, 0.236, 0.382, 0.5, 0.618, 0.786, 1.0).
Displays a dashed line connecting the two pivot points.
Draws horizontal lines and labels at each selected level.
Shows a status label if valid pivots are not yet found.
⚙️ Inputs
Deviation % Multiplier: Adjusts the sensitivity based on ATR% to ignore small fluctuations.
Pivot Depth: Controls how many bars before/after a point are used to confirm a pivot.
Extend Lines Left/Right: Allows you to keep the levels visible into past/future bars.
Color Customization: Choose custom colors for each level.
Select Which Levels to Show: Toggle levels like 0.382 or 0.786 on/off based on preference.
🧠 How It Works
Pivot Detection
A price is considered a valid high/low pivot if it is the highest/lowest point within a lookback window (depth).
Deviation Filter
To avoid false pivots, the script calculates the % deviation between the new pivot and the last one using ATR/Close. Only when this exceeds a -defined threshold, the new pivot is accepted.
Fibonacci Calculation
Once a valid new pivot is confirmed, the script draws levels between the latest two swings using the standard Fibonacci ratios.
✅ Key Features
Non-repainting logic for confirmed pivots
Works across all symbols and asset classes
Fully customizable and extendable
Clean, lightweight, and script-efficient
Built with Pine Script v5 standards
Uses request.security() to ensure pivot detection from the selected HTF
No proprietary or obfuscated code
📊 Best Use Cases
Identifying key retracement zones during pullbacks
Confirming /resistance with fib confluence
Planning entries/exits around dynamic fib areas
Works well in swing trading setups
📌 Important Notes
This tool does not repaint once pivot structure is confirmed.
Designed as a tool, not a signal generator.
Can be combined with RSI, MACD, volume, or price action for better confirmation.
📜 Disclaimer
This script is developed independently and shared publicly for educational and analytical use only. It is not intended to copy or infringe upon any commercial tool or proprietary indicator. Use at your own discretion. No investment advice is implied.
📧 For or suggestions, feel free to connect through TradingView profile messages.
💡 Happy Trading!

Trend Com – Multi-Layer Momentum Map for CryptoVisualize three popular momentum tools in one view: RSI, MACD Histogram, and Stochastic.
Built for crypto traders on the daily timeframe, beginner-friendly but insightful for pros .
No signals or alerts—just a clean, visual momentum map to guide your market feel.
🧠 Logic
This script combines three widely-used momentum indicators (RSI, MACD Histogram, and Stochastic) into one unified layout.
It offers a non-signaling, educational view to help traders understand market momentum at a glance.
There are no buy/sell triggers—just raw data visualization for personal interpretation.
⏱️ Timeframe
Optimized for the daily (1D) timeframe.
Use on lower timeframes is technically possible but may reduce effectiveness.
Best when combined with higher-timeframe analysis for trend confirmation.
⚙️ Settings
Fully adjustable inputs are provided for all three indicators:
RSI Length
MACD Fast / Slow / Signal
Stochastic %K / %D / SmoothK
This allows you to match the script to your own trading style and preference.
🧩 Utility
A blended display of momentum behavior from three sources:
RSI shows strength relative to recent price action
MACD Histogram reveals trend acceleration or weakening
Stochastic helps identify local turning points
Together, they form a layered visual "map" of market rhythm.
⚠️ Warnings
This tool provides no alerts, signals, or trade advice.
It is not intended for automated or rule-based trading.
Educational use only—aimed primarily at helping newer traders understand momentum dynamics.
🖼 Visual Explanation
The most critical visual in this tool is the orange histogram, which appears as soon as you run the script.
These bars represent the difference between MACD and its Signal line—known as the MACD Histogram.
Interpretation:
Bars above zero and rising = bullish momentum increasing
Bars below zero and falling = bearish pressure gaining strength
When crossing zero = possible momentum shift
✳️ This helps you instantly recognize the current strength and direction of market momentum without decoding multiple charts.
✨ Need a little love !
We put so much love and time into bringing you useful content & your truly keeps us going. don’t be shy—drop a comment below. We’d love to hear from you! 💛
Big thanks,
Mad Whale 🐋
📜 Please to do your own research before making any investment decisions. Also, don’t forget to check the disclaimer at the bottom of each post for more details.

EMA Crossover with RSI FilterWhat this indicator does:
Plots two EMAs (default: 9 & 21).
Uses RSI to filter entries (avoids buy signals when RSI is overbought, sell signals when RSI is oversold).
Gives simple visual buy/sell signals when EMA crossovers occur and RSI confirms.
Light background color to visualize bullish/bearish conditions.

Kurtosis Sentinel V1.0Kurtosis Sentinel — Market Trap Detection System
A precision-engineered reversal system based on fat-tail volatility detection and structural market logic.
Kurtosis Sentinel detects leptokurtic price behavior (a.k.a. explosive tails), then confirms with volume surges, trap candles, and market structure shifts, giving you sniper-level reversal zones.
🔍 What it does:
•Kurtosis Scanning: Identifies statistically extreme “tail” behavior — often where traps form.
•Volume Spike Filters: Ensures signals only fire when volume confirms intent.
•Structure Breaks: Validates with breakout logic from recent highs/lows.
•Reversal Candlestick Traps: Includes engulfing bars, pin bars, inside bars, with ATR-based filters.
•Entry/Stop/Retest Visuals: Automatically marks tactical execution points.
•Shaded Trap Zones: Uses box.new to visualize price magnet areas clearly.
Best For:
•Intraday scalpers looking for exhaustion traps
•Swing traders seeking low-risk reversal zones
•Quant-savvy traders who want to go beyond RSI/EMA memes

NonLag MAThe Non-Lag Moving Average (MA) is a technical analysis indicator designed to track price trends with significantly less lag than traditional moving averages like the SMA or EMA.
Its primary purpose is to provide a smoother, more responsive representation of the current price direction. It achieves this by using a complex, adaptive filtering algorithm—often involving trigonometric functions (like the cosine function in the code you provided)—to assign weights to past price data. This sophisticated calculation allows it to stay closer to the price action, aiming to give earlier and more reliable trend signals.
Traders use the Non-Lag MA to:
Identify Trend Direction : The slope and color of the indicator line clearly signal whether the market is in an uptrend (rising) or a downtrend (falling).
Generate Crossover Signals : Like other moving averages, a faster Non-Lag MA crossing above a slower one can indicate a buy signal, while a cross below can signal a sell.
---
Just another publicly available indicator from MT5 translated.

Robby DSS Bressert Colored DotsIntroduction
The Robby DSS Bressert Colored Dots is a technical analysis tool designed to measure momentum and identify potential overbought or oversold conditions in a market. It is a visually enhanced version of the Double Smoothed Stochastic (DSS) indicator, which was developed to be a smoother and more responsive version of the traditional Stochastic Oscillator.
This specific version provides at-a-glance information about momentum shifts through the use of colored dots, making it easy to interpret.
The Core Engine: DSS Bressert
The foundation of this indicator is the Double Smoothed Stochastic, a concept attributed to both William Blau and Walter Bressert, who introduced similar ideas. The goal of the DSS is to filter out the "noise" and false signals common in standard oscillators without introducing significant lag.
It achieves this through a two-step smoothing process:
First Smoothing: A standard Stochastic value is calculated based on the price. This value is then smoothed using an Exponential Moving Average (EMA). This creates a cleaner, less erratic line than the raw stochastic.
Second Smoothing: The indicator then takes this newly smoothed line and performs a second Stochastic calculation on it. This result is then smoothed one final time with another EMA.
This double-application of smoothing results in a very clean oscillator line that reacts quickly to price changes but is less prone to whipsaws.
The Visual Modification: "Robby" Colored Dots
The "Robby DSS Bressert Colored Dots" version takes the powerful DSS calculation and adds a unique visual layer for easier interpretation.
Colored Dots: Instead of plotting a continuous line, the indicator displays a dot for each candle. The color of this dot instantly tells you about the indicator's momentum:
Lime/Green dots appear when the DSS value is rising, indicating bullish or positive momentum.
Red dots appear when the DSS value is falling, indicating bearish or negative momentum.
If the value is unchanged, the dot retains the color of the previous one.
The "Robby" Name: In trading communities like Forex Factory and MQL5, it's common for programmers to modify popular indicators. These enhanced versions are often named after the member who created or popularized them. The "Robby" version specifically refers to this popular colored-dot modification of the DSS Bressert.
How to Interpret and Use It
Traders typically use the Robby DSS Bressert Colored Dots in a few key ways:
Momentum Shifts: The most straightforward signal is the change of dot color. A switch from red to lime can signal that downside momentum is waning and a potential move up is beginning. A switch from lime to red signals the opposite.
Overbought & Oversold Conditions: Like a standard stochastic, the indicator uses levels (typically 80 and 20).
When the dots are above 80, the market is considered overbought. A color change from lime to red in this zone can be a strong signal for a potential reversal down.
When the dots are below 20, the market is considered oversold. A color change from red to lime here can signal a potential reversal up.
Trend Confirmation: In a strong uptrend, traders might ignore red dots and use the appearance of lime dots in the oversold zone (or after a minor pullback) as a signal to the trend. The opposite is true in a downtrend.
---
This is just an indicator that can found publicly online for mt4, and just translated it to Pinescript.

Sally's 9 EMA Strategy Local 3A simple script to count the number of 1 min bars that close over or under the 9 ema. It starts displaying at the 2 min bar and indicates buy/sell on the 4 min bar. The idea is to wait for the 5th bar to close to confirm. If the sequence has a + next to the numbers it means that all the bars are trending in the same direction as well as over the 9 ema.

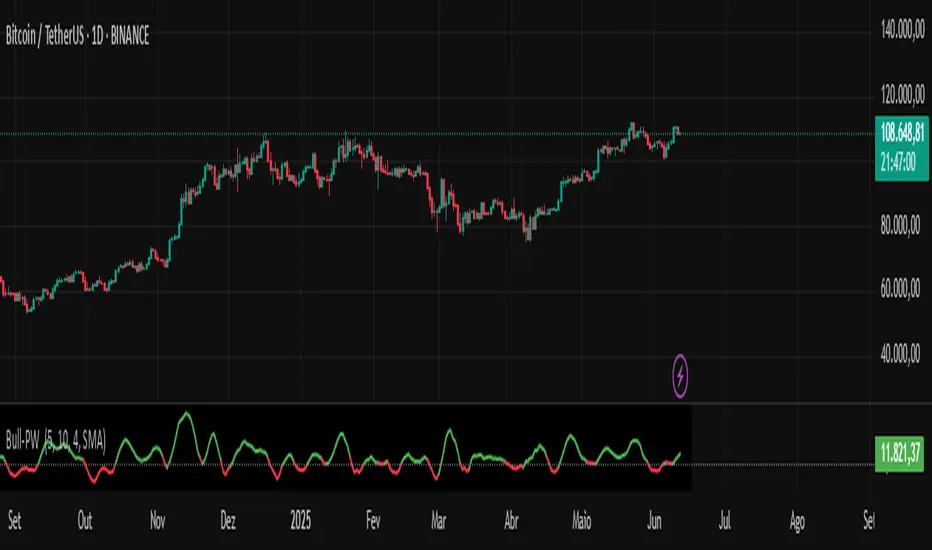
Chaikin Bull-Power OscillatorThis indicator is given with much love and care to the community to help you in your trading operations.
How to use the "Chaikin-Bull-PW" Indicator
The Chaikin-Bull-PW is an oscillator based on the Accumulation/Distribution (AD) line smoothed by different methods, called here the "Hull Chaikin Oscillator." It compares two smoothed averages of the AD line — a short period and a long period — to indicate the strength and direction of buying and selling pressure in the market.
Adjustable Parameters:
Short Period: Number of bars used to calculate the short smoothed average of the AD line. Shorter periods make the indicator more sensitive.
Long Period: Number of bars used to calculate the long smoothed average of the AD line. Longer periods smooth the indicator more.
Background Offset: Controls the offset of the chart’s background color.
Smoothing Type: Choose the smoothing method for the AD line among HMA, SMA, SMMA, EMA, WMA, and JMA. This affects how the averages are calculated and how the oscillator responds to price.
Indicator Interpretation:
The oscillator is the difference between the short and long smoothed averages of the AD line.
When the oscillator is above zero (green), it indicates increasing buying pressure, suggesting an uptrend.
When the oscillator is below zero (red), it indicates increasing selling pressure, suggesting a downtrend.
The zero line acts as a reference for trend changes.
Usage Suggestions:
Use the oscillator crossing the zero line to identify potential entry or exit points.
Combine with other indicators or chart analysis to confirm signals.
Adjust the periods and smoothing type to fit your asset and timeframe.
Smart Order Block IdentifierThis custom TradingView indicator identifies and highlights Smart Money Order Blocks (OBs) based on refined multi-candle price action logic. It detects bearish and bullish order blocks using a structured pattern involving five candles. For a bearish order block, the central (OB) candle must have a high that is greater than the highs of both the candle before and after it—signaling local strength. Additionally, the high of the candle two bars after (the “next-next” candle) must be lower than the OB candle’s low, indicating a potential shift in momentum and confirming bearish intent. Conversely, a bullish order block is identified when the OB candle has a low lower than the lows of both the previous and following candle. The candle two bars later must have a low higher than the OB candle’s high, showing price rejection and a likely reversal. The indicator marks these blocks visually with boxes on the chart and optionally filters out mitigated zones.

Smart OBsSmart Order Block Indicator with Mitigation Detection
This indicator identifies bullish and bearish order blocks on the chart using a price action-based logic. For a bearish order block, it detects a candle whose high is higher than the highs of the candles immediately before and after it, followed by a candle after the next one whose high is below the low of the order block candle. Conversely, a bullish order block is identified where a candle’s low is lower than the lows of its neighboring candles and the subsequent candle after next has a low above the high of the order block candle. This method helps to spot potential areas where institutional buying or selling occurred.
Once identified, the indicator plots rectangular zones on the chart highlighting these order blocks, allowing traders to visualize key supply and demand areas. The zones extend forward by a configurable number of bars to anticipate potential future price reactions. Additionally, the indicator checks if the order block zone has been “mitigated” or “consumed” by current price action, meaning price has retraced into or through the zone, potentially weakening its strength. Mitigated zones are not replotted, keeping the chart cleaner.
This tool assists traders in spotting high-probability reversal or continuation zones, aiding in entry, stop-loss, and take-profit placement decisions by visually marking institutional order flow areas.

A+ Trade CheckList with Comprehensive Relative StrengthThe indicator designed for traders who need real-time market assessment across multiple timeframes and benchmarks. This comprehensive tool combines traditional technical analysis with sophisticated relative strength measurements to provide a complete market picture in one convenient table display.
The indicator tracks essential trading levels including:
QQQ and SPY trend analysis using exponential moving averages
Previous day and week high/low levels for key and resistance
Market open levels from the first 5 and 15 minutes of trading (9:30 AM ET)
VWAP positioning for institutional price reference
Short-term EMA positioning for momentum assessment
Advanced Relative Strength Analysis
The standout feature of this indicator is its comprehensive 8-metric relative strength scoring system that compares your current ticker against both QQQ (Nasdaq-100) and SPY (S&P 500) benchmarks.
The 4-Metric Relative Strength System Explained
Metric 1: Relative Strength Ratio (RSR)
Purpose: Measures whether your ticker is outperforming or underperforming relative to its historical relationship with the benchmarks.
How it works:
Calculates the ratio of your ticker's price to QQQ/SPY prices
Compares current ratio to a 20-period moving average of the ratio
Scores +1 if ratio is above average (relative strength), -1 if below (relative weakness)
Trading significance: Identifies when a stock is breaking out of its normal correlation pattern with major indices.
Metric 2: Percentage-Based Relative Performance
Purpose: Compares short-term percentage changes to identify immediate relative momentum.
How it works:
Calculates 5-day percentage change for your ticker and benchmarks
Subtracts benchmark performance from ticker performance
Scores +1 if outperforming by >1%, -1 if underperforming by >1%, 0 for neutral
Trading significance: Captures recent momentum shifts and identifies stocks moving independently of market direction.
Metric 3: Beta-Adjusted Relative Strength (Alpha)
Purpose: Measures risk-adjusted performance by ing for the ticker's natural volatility relationship with benchmarks.
How it works:
Calculates rolling beta (correlation and variance relationship)
Determines expected returns based on benchmark moves and beta
Measures alpha (excess returns above/below expectations)
Scores based on whether alpha is consistently positive or negative
Trading significance: Identifies stocks generating returns beyond what their risk profile would suggest, indicating fundamental strength or weakness.
Metric 4: Volume-Weighted Relative Strength
Purpose: Incorporates volume analysis to validate price-based relative strength signals.
How it works:
Compares VWAP-based percentage changes between ticker and benchmarks
Applies volume weighting factor based on relative volume strength
Enhances score when high relative volume confirms price movements
Trading significance: Distinguishes between genuine institutional-driven moves and low-volume price action that may not sustain.
Combined Scoring System
The indicator generates 8 individual scores (4 metrics × 2 benchmarks) that combine into a single strength assessment:
Score Interpretation
Strong (4-8 points): Ticker significantly outperforming both benchmarks across multiple methodologies
Moderate Strong (1-3 points): Ticker showing good relative strength with some mixed signals
Neutral (0 points): Balanced performance relative to benchmarks
Moderate Weak (-1 to -3 points): Ticker showing relative weakness with some mixed signals
Weak (-4 to -8 points): Ticker significantly underperforming both benchmarks
Display Format
The indicator shows results as: "Strong (6/8)" indicating the ticker scored 6 out of 8 possible points.

SignalWatcherThis script provides real-time monitoring of multiple technical indicators and generates visual alerts and configurable alarms:
Inputs & Mini-GUI
MACD Settings: Activation, fast, slow and signal line lengths.
RSI Settings: Activation, period length, overbought and oversold thresholds.
ADX Settings: Activation, period length, smoothing and trend strength thresholds.
Volume Settings: Activation, length of the volume MA, factor for detecting volume peaks.
Global Alert: A single composite alert for all signals.
Plot Settings: Activation and deactivation of the plot displays for RSI, MACD (lines) and ADX. Color and width selection for each line.
Display Table: Activation of the status table.
Calculations
MACD: Generates macdLine and signalLine, detects crossovers (bullish) and crossunders (bearish).
RSI: Calculates rsi_val, compares with rsi_ob and rsi_os to determine overbought/oversold.
ADX: Uses ta.dmi() to determine adx_val and checks against adx_thresh for trend strength.
Volume Spike: Exceptional trading activity detected by moving average (vol_ma) and factor (vol_factor).
Alert conditions
Six individual alertcondition() calls: MACD ↑/↓, RSI Overbought/Oversold, ADX Strong Trend, Volume Spike.
Optional composite alert (enable_global): A single notification when one of the indicator signals strikes.
Visual overlays
Alarm overlay (bottom right): Red table with text lines for currently triggered signals.
Status Table (bottom left): Overview of all indicators with current status (On/Off, Values, Thresholds).
Plots in the chart
RSI, MACD Line & Signal Line, ADX: Are displayed as lines if activated in the GUI; configurable colors & line thicknesses.
NinjaTrendAdvanced TradingView Indicator for Multi-Timeframe Trend Analysis with Volume Confirmation
Key Features
Multi-Timeframe Analysis:
Displays trends across H4, H1, M15, and M5 (configurable)
Organized dashboard in the top-right corner
Trend Filters:
Uses 4 EMAs (21, 50, 100, 200 periods - customizable)
Classifies trends as:
SUPER BULLISH ▲
Strong Uptrend
Weak Uptrend
Sideways
Weak Downtrend
Strong Downtrend
SUPER BEARISH ▼
Additional Filters:
ADX to confirm trend strength (configurable)
Volume filter to validate movements (volume above average)
How to Use
Dashboard:
4 columns: Timeframe | ADX | Volume | Trend
Color-coded signals for quick interpretation
Interpretation:
"SUPER" trends (bright green/red) indicate strongest signals
Volume icons:
✅ Confirmed
☑ Not confirmed
ADX values turn orange when above threshold (default: 25)
Customization:
Toggle specific timeframes on/off
Adjust EMA periods
Configure ADX thresholds and volume sensitivity

Daily Range + Trading sessionsIndicator that shows daily ranges on the chart.
Marks every trading session in a day.

PAC INDEXThis indicator plots a Price Action Channel (PAC) using a Smoothed Moving Average (SMMA) of highs and lows, and overlays these bands directly on the main chart. It uses standard Heiken Ashi calculations (not the built-in function) to highlight price structure with an emphasis on trend exhaustion and volatility.
Features
Plots PAC High and PAC Low –
Customizable channel boundaries using SMMA smoothing ( sets lookback length).
Heiken Ashi Calculation (manual):
Heiken Ashi open, close, high, and low are computed per-bar for deeper trend insight.
Visual Channel Fill:
The space between PAC High and Low is filled for instant trend identification.
Condition Markers:
Dots appear above bars when the Heiken Ashi close exceeds the PAC High (potential overextension or momentum).
Dots appear below bars when the Heiken Ashi close falls below the PAC Low (potential exhaustion or reversal).
Configurable:
can adjust the smoothing length to fit different trading styles or market volatility.
⸻
How To Use
Add to any chart and timeframe (works on all symbols).
Watch the channel:
When Heiken Ashi closes break above the PAC High, price may be in a strong trend or overbought zone.
When Heiken Ashi closes break below the PAC Low, price may be in an exhaustion or potential reversal zone.
Adjust the “Length” parameter for tighter (shorter) or wider (longer) channels depending on your strategy.
Use as a filter for trade entries/exits or to confirm momentum and exhaustion within your price action framework
.
Notes
All calculations are performed directly in the script for transparency and customization.
This indicator is not a buy/sell signal system—interpret breakouts and channel extremes within your own trade plan.

Fixed Trading - JeremyZanXMaps out the range on the 23rd hour of each day for the past 100 days. It then provides some tradable price points based upon the range derived. Meant to be used on the H1 ONLY. Hasn't been programmed to work on any other timeframe.

Adaptive Momentum Scalper (AMS) - ADX/RSI Filters Fixed### 📘 Strategy Description: **Adaptive Momentum Scalper (AMS) – Prop Firm Edition**
The **Adaptive Momentum Scalper (AMS)** is a breakout-based trend-following strategy designed with **prop firm trading rules and risk management** in mind. It combines volatility, momentum, and trend filters with dynamic sizing to manage risk across changing market conditions.
#### ✅ Core Features:
* **Breakout Logic**: Enters long or short when price breaks above/below a short-term range.
* **Momentum Filter**: Confirms breakouts with ATR-based price momentum.
* **Trend Filter**: Uses EMA(20) to ensure directional bias.
* **Volatility Filter**: Requires ATR > ATR average to avoid choppy zones.
* **ADX Filter (Optional)**: Confirms strength of trend (default ADX > 20).
* **RSI Zone Filter (Optional)**: Limits long trades to RSI > 50, shorts to RSI < 50.
* **Dynamic Position Sizing**: Risk-based lot sizing tied to ATR and equity.
* **Hard SL/TP or Time-Based Exit**: Trades close by target, stop, or max bars in trade.
* **Session Filtering**: Trade only within configured hours (to avoid high spread periods).
* **Prop Firm Safety-Oriented**: Configurable to stay within max drawdown rules.
---
### ⚙️ Settings:
* **Risk per Trade** (% of equity)
* **ATR multipliers** for stop loss and take profit
* **Trading hours** (e.g. 1 AM to 10 PM EST)
* **Max bars in trade before exit**
* **Enable/disable**:
* ADX filter
* RSI filter
---
### 🎯 Ideal Use:
* Scalping on **Gold (XAUUSD)** or other volatile assets.
* Forward testing under prop firm conditions (3% daily / 6% max drawdown).
* Identifying breakout opportunities with strong trend and momentum backing.

Normalized Volume & True RangeThis indicator solves a fundamental challenge that traders face when trying to analyze volume and volatility together on their charts. Traditionally, volume and price volatility exist on completely different scales, making direct comparison nearly impossible. Volume might range from thousands to millions of shares, while volatility percentages typically stay within single digits. This indicator brings both measurements onto a unified scale from 0 to 100 percent, allowing you to see their relationship clearly for the first time.
The core innovation lies in the normalization process, which automatically calculates appropriate scaling factors for both volume and volatility based on their historical statistical properties. Rather than using arbitrary fixed scales that might work for one stock but fail for another, this system adapts to each instrument's unique characteristics. The indicator establishes baseline averages for both measurements and then uses statistical analysis to determine reasonable maximum values, ensuring that extreme outliers don't distort the overall picture.
You can choose from three different volatility calculation methods depending on your analytical preferences. The "Body" option measures the distance between opening and closing prices, focusing on the actual trading range that matters most for price action. The "High/Low" method captures the full daily range including wicks and shadows, giving you a complete picture of intraday volatility. The "Close/Close" approach compares consecutive closing prices, which can be particularly useful for identifying gaps and overnight price movements.
The indicator displays volume as colored columns that match your candlestick colors, making it intuitive to see whether high volume occurred during up moves or down moves. Volatility appears as a gray histogram, providing a clean background reference that doesn't interfere with volume interpretation. Both measurements are clipped at 100 percent, which represents their calculated maximum normal values, so any readings near this level indicate unusually high activity in either volume or volatility.
The baseline reference line shows you what "normal" volume looks like for the current instrument, helping you quickly identify when trading activity is above or below average. Optional moving averages for both volume and volatility are available if you prefer smoothed trend analysis over raw daily values. The entire system updates in real-time as new data arrives, continuously refining its statistical calculations to maintain accuracy as market conditions evolve.
This two-in-one indicator provides a straightforward way to examine how price movements relate to trading volume by presenting both measurements on the same normalized scale, making it easier to spot patterns and relationships that might otherwise remain hidden when analyzing these metrics separately.

Failed 2 Candle Detector (Highlight)Failed 2 bar indicator. Failed two in this indicator is determined by the failed candle closing above or below the 50% level of the previous candle.

EMAs mit RSI & Candlestick-Signalen & großen KerzenkörpernMulti-Signal Indicator: EMAs, Candlestick Patterns & RSI Signals
This versatile indicator combines three proven technical analysis tools in a single script:
🔹 1. Exponential Moving Averages (EMAs)
Multiple EMAs are displayed on the chart, helping to quickly identify trends. You can customize the periods - ideal for short-term and long-term strategies.
🔹 2. candlestick pattern recognition
The indicator automatically recognizes common bullish and bearish candlestick formations such as:
Hammer / Hanging Man
Engulfing Pattern
Doji / Spinning Top
As soon as a pattern is recognized, a visual marker appears on the chart.
🔹 3. RSI-based signals
The Relative Strength Index (RSI) is analyzed to identify overbought and oversold conditions. Additional visual cues help to identify potential reversal points.
✅ Advantages:
All-in-one indicator - no overload from multiple scripts
Visual clarity through clear markings and coloring
Fully customizable in the settings menu
⚙️ Application:
Suitable for traders who want to trade technical patterns, follow trends or react to RSI reversal points.
Note: This indicator is for educational purposes only and is not a substitute for sound trading strategy or financial advice.

Dual SMA Crossover StrategyDual SMA Crossover Strategy with Advanced Risk Management
This Pine Script strategy utilizes a Dual Simple Moving Average (SMA) Crossover system for identifying trend changes, enhanced with comprehensive money and risk management features.
Strategy Logic
The core of the strategy is based on the interaction of two SMAs: a Fast SMA (default 24 periods) and a Slow SMA (default 48 periods).
Long Entry: Triggered when the Fast SMA crosses above the Slow SMA.
Short Entry: Triggered when the Fast SMA crosses below the Slow SMA.
Exit: Positions are closed when an opposite crossover signal occurs.
All trading decisions are made on the close of the candle to prevent any look-ahead bias, ensuring realistic backtest results.
Key Risk Management Features
Money Management:
Risk Per Trade (%): Defines the maximum percentage of equity to risk on any single trade (default 2.0%). Position sizing is automatically calculated to ensure this risk limit is not exceeded when the Stop Loss is hit.
Stop Loss (SL):
A fixed Stop Loss (%) (default 0.8%) from the entry price is set immediately upon trade entry to limit potential losses.
Take Profit (TP):
A Risk-Reward Ratio (default 2.0) is used to calculate the Take Profit target. For instance, a 2.0 RRR with a 0.8% SL means a 1.6% TP target.
Advanced Trailing Stop Loss (TSL):
Trailing Stop Start (%): The TSL only activates once the trade reaches a predefined profit percentage (default 1.0%).
Trailing Stop Trail (%): Once activated, the TSL moves to lock in profits by trailing the highest (for long) or lowest (for short) price by a specified percentage (default 0.5%). This ensures that the TSL level never falls below the initial Stop Loss, providing continuous risk protection while allowing for further profit accumulation.
This strategy provides a robust framework for trend-following with built-in risk controls, aiming to protect capital and manage potential gains effectively.
