TradeQUO Herrick Payoff RSIHerrick Payoff Index RSI (HPI-RSI) with Signal Line
An advanced oscillator that measures market strength not just by price, but by "smart money flow."
This indicator is not a typical RSI. Instead of applying the Relative Strength Index to price alone, it calculates it on the cumulative Herrick Payoff Index (HPI) . This creates a unique oscillator that reflects the underlying sentiment and capital flow in the market.
What is the Herrick Payoff Index (HPI)?
The HPI is a classic sentiment indicator that combines three crucial elements to determine if money is flowing into or out of an asset:
Price Change: The direction and momentum of the market.
Trading Volume: The conviction behind the price movement.
Open Interest (OI): The total number of open contracts (mainly in futures), which indicates if new capital is entering the market.
By combining these factors, the HPI provides a more comprehensive picture of market strength than indicators based solely on price.
How This Indicator Works
The script follows a logical, multi-step process:
It calculates the raw Herrick Payoff Index for each bar.
It creates a cumulative sum of this index to generate a continuous money flow value.
This cumulative value is smoothed with a short-period EMA to reduce noise.
The RSI is then applied to this smoothed HPI value.
An additional, configurable signal line (moving average) is added to facilitate trading signals.
Interpretation and Application
You can use this indicator much like a standard RSI, but with the added context of money flow:
Overbought/Oversold: Values above 70 suggest an overbought condition, while values below 30 signal an oversold condition.
Signal Line Crossovers: A cross of the HPI-RSI line above the signal line can be seen as a bullish signal. A cross below can be seen as a bearish signal.
Divergences: Look for divergences between the indicator and the price. A bullish divergence (price makes a lower low, indicator makes a higher low) can indicate an move to the upside. A bearish divergence (price makes a higher high, indicator makes a lower high) can signal a potential move to the downside.
Settings
The indicator has been deliberately kept simple:
HPI Smoothing Length: Smoothing length (1-5) for the cumulative HPI.
RSI Length: The lookback period for the RSI calculation.
Signal Line Settings: Here you can enable/disable the signal line and customize its type and length.
Display Settings: Adjust the colors of the RSI and signal lines to your preference.
This indicator is a tool for analysis and should always be used in combination with other methods and a solid risk management strategy. Happy trading!
Indicadores y estrategias

StochFusion – Multi D-LineStochFusion – Multi D-Line
An advanced fusion of four Stochastic %D lines into one powerful oscillator.
What it does:
Combines four -weighted Stochastic %D lines—from fastest (9,3) to slowest (60,10)—into a single “Fusion” line that captures both short-term and long-term momentum in one view.
How to use:
Adjust the four weights (0–10) to emphasize the speed of each %D component.
Watch the Fusion line crossing key zones:
– Above 80 → overbought condition, potential short entry.
– Below 20 → oversold condition, potential long entry.
– Around 50 → neutral/midline, watch for trend shifts.
Applications:
Entry/exit filter: Only take trades when the Fusion line confirms zone exits.
Trend confirmation: Analyze slope and cross of the midline for momentum strength.
Multi-timeframe alignment: Use on different chart resolutions to find confluence.
Tips & Tricks:
Default weights give more influence to slower %D—good for trend-focused strategies.
Equal weights provide a balanced oscillator that mimics an ensemble average.
Experiment: Increase the fastest weight to capture early reversal signals.
Developed by: TradeQUO — inspired by DayTraderRadio John
“The best momentum indicator is the one you adapt to your own trading rhythm.”

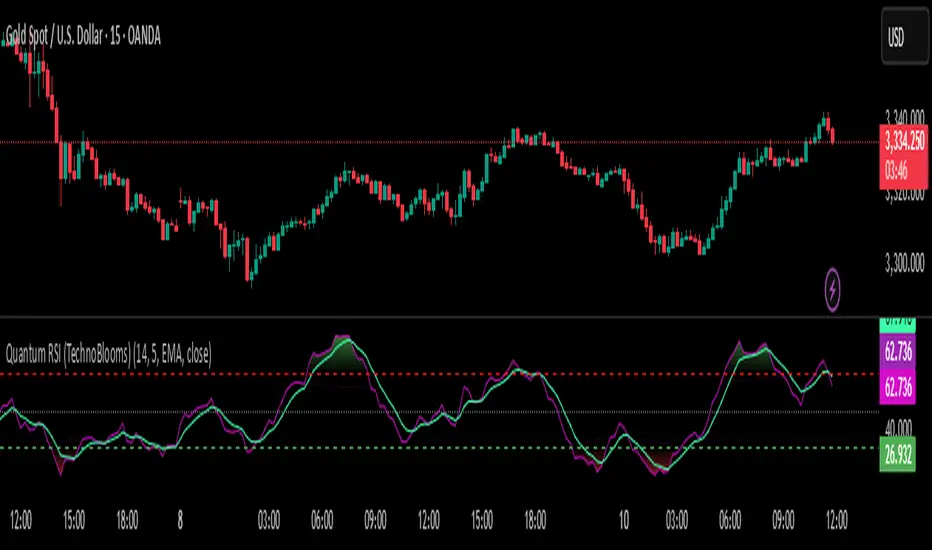
Quantum RSI (TechnoBlooms)The Next Evolution of Momentum Analysis
📘 Overview
Quantum RSI is an advanced momentum oscillator based on Quantum Price Theory, designed as a superior alternative to the traditional RSI. It incorporates a Gaussian decay function to weigh price changes, creating a more responsive and intuitive measure of trend strength.
This indicator excels in identifying micro-trends and subtle momentum shifts — especially in narrow or low-volatility environments where standard RSI typically lags or gives false signals. With its enhanced smoothing, intuitive color gradients, and customizable moving average, Quantum RSI offers a powerful tool for traders seeking clarity and precision.
🔍 Key Features
• ⚛️ Quantum Momentum Engine: Measures net momentum using quantum-inspired Gaussian decay weighting.
• 🎨 Color-Reversed Gradient Zones:
o Green (Overbought): Shows momentum strength, not weakness.
o Red (Oversold): Highlights momentum exhaustion and potential bounce.
• 🧠 Smoothing with MA: Option to apply moving average (SMA/EMA/WMA/SMMA/VWMA) to the Quantum RSI line.
• 📊 Levels at 30 / 50 / 70: Standard RSI levels for decision-making guidance.
• 📈 Intuitive Visuals: Gradient fills for cleaner interpretation of zones and transitions.
👤 Who Is It For?
• Technical traders seeking a modern alternative to RSI.
• Quantitative analysts who value precision and smooth signal flow.
• Visual traders looking for intuitive, color-coded trend zones.
• Traders focused on market microstructure and early trend detection.
💡 Pro Tips
• Pair with order blocks, market structure tools, or Fibonacci confluences for high-probability entries.
• Use on assets with frequent compression or consolidation, where traditional RSI often misleads.
• Combine with volume-based indicators or smart money concepts for added confirmation.
• Ideal for sideways markets, false breakouts, or low-volatility zones where typical RSI lags.
Open Interest-RSI + Funding + Fractal DivergencesIndicator — “Open Interest-RSI + Funding + Fractal Divergences”
A multi-factor oscillator that fuses Open-Interest RSI, real-time Funding-Rate data and price/OI fractal divergences.
It paints BUY/SELL arrows in its own pane and directly on the price chart, helping you spot spots where crowd positioning, leverage costs and price action contradict each other.
1 Purpose
OI-RSI – measures conviction behind position changes instead of price momentum.
Funding Rate – shows who pays to hold positions (longs → bull bias, shorts → bear bias).
Fractal Divergences – detects HH/LL in price that are not confirmed by OI-RSI.
Optional Funding filter – hides signals when funding is already extreme.
Together these elements highlight exhaustion points and potential mean-reversion trades.
2 Inputs
RSI / Divergence
RSI length – default 14.
High-OI level / Low-OI level – default 70 / 30.
Fractal period n – default 2 (swing width).
Fractals to compare – how many past swings to scan, default 3.
Max visible arrows – keeps last 50 BUY/SELL arrows for speed.
Funding Rate
mode – choose FR, Avg , Index, Avg Prem + PI or FR-candle.
Visual scale (×) – multiplies raw funding to fit 0-100 oscillator scale (default 10).
specify symbol – enable only if funding symbol differs from chart.
use lower tf – averages 1-min s for smoother intraday view.
show table – tiny two-row widget at chart edge.
Signal Filter
Use Funding filter – ON hides long signals when funding > Buy-threshold and short signals when funding < Sell-threshold.
BUY threshold (%) – default 0.00 (raw %).
SELL threshold (%) – default 0.00 (raw %).
(Enter funding thresholds as raw percentages, e.g. 0.01 = +0.01 %).
3 Visual Outputs
Sub-pane
Aqua OI-RSI curve with 70 / 50 / 30 reference lines.
Funding visualised according to selected mode (green above 0, red below 0, or other).
BUY / SELL arrows at oscillator extremes.
Price chart
Identical BUY / SELL arrows plotted with force_overlay = true above/below candles that formed qualifying fractals.
Optional table
Shows current asset ticker and latest funding value of the chosen mode.
4 Signal Logic (Summary)
Load _OI series and compute RSI.
Retrieve Funding-Rate + Index (optionally from lower TF).
Find fractal swings (n bars left & right).
Check divergence:
Bearish – price HH + OI-RSI LH.
Bullish – price LL + OI-RSI HL.
If Funding-filter enabled, require funding < Buy-thr (long) or > Sell-thr (short).
Plot arrows and trigger two built-in alerts (Bearish OI-RSI divergence, Bullish OI-RSI divergence).
Signals are fixed once the fractal bar closes; they do not repaint afterwards.
5 How to Use
Attach to a liquid perpetual-futures chart (BTC, ETH, major Binance contracts).
If _OI or funding series is missing you’ll see an error.
Choose timeframe:
15 m – 4 h for intraday;
1 D+ for swing trades.
Lower TFs → more signals; raise Fractals to compare or use Funding filter to trim noise.
Trade checklist
Funding positive and rising → longs overcrowded.
Price makes higher high; OI-RSI makes lower high; Funding above Sell-threshold → consider short.
Reverse logic for longs.
Combine with trend filter (EMA ribbon, SuperTrend, etc.) so you fade only when price is stretched.
Automation – set TradingView alerts on the two alertconditions and send to webhooks/bots.
Performance tips
Keep Max visible arrows ≤ 50.
Disable lower-TF aggregation if script feels heavy.
6 Limitations
Some symbols lack _OI or funding history → script stops with a console message.
Binance Index begins mid-2020; older dates show na.
Divergences confirm only after n bars (no forward repaint).
7 Changelog
v1.0 – 10 Jun 2025
Initial public release.
Added price-chart arrows via force_overlay.

Mark the last 20th candleThis Pine Script indicator, titled "Mark last 20 candle" (short name: "Last 20"), was designed to visually highlight a specific candle on your TradingView chart.
What the indicator does:
The main function of this script is to exclusively mark the first candle within the most recent window of 20 candles on your chart . Instead of coloring all 20 candles, it precisely identifies and highlights only the beginning of this 20-candle sequence.
How the indicator works:
Number of candles: The script uses a -defined variable, num_candles_to_mark , set to 20 , to specify the size of the relevant candle window.
Dynamic Identification: The indicator uses the built-in Pine Script variables:
bar_index: Represents the index of the currently processed candle (starting at 0).
last_bar_index: Represents the index of the very last available candle in your chart (the most recent).
Precise Marking: The core logic bar_index == last_bar_index - num_candles_to_mark + 1 calculates the exact index of the candle that is 20 bars before the last_bar_index . If the bar_index of the currently processed candle matches this calculated position, that specific candle is colored blue with 80% transparency.
Automatic Shift: As new candles appear on your chart (and last_bar_index increases accordingly), the calculated target index ( last_bar_index - num_candles_to_mark + 1 ) also automatically shifts one bar to the right. This ensures that the marked candle automatically "moves along" and always highlights the first candle of the current 20-candle window.
Usage:
This indicator is useful for traders who want to visually track the starting point of a fixed window of recent price action. It can help identify patterns or apply strategies relative to that specific candle.
To use it, simply copy the provided Pine Script code into your TradingView Pine Editor and add it to your chart. The marked candle will dynamically update as new data arrives.

Mark last 20 CandleThis Pine Script indicator, titled "Mark last 20 candle" (short name: "Last 20"), was designed to visually highlight a specific candle on your TradingView chart.
What the indicator does:
The main function of this script is to exclusively mark the first candle within the most recent window of 20 candles on your chart . Instead of coloring all 20 candles, it precisely identifies and highlights only the beginning of this 20-candle sequence.
How the indicator works:
Number of candles: The script uses a -defined variable, num_candles_to_mark , set to 20 , to specify the size of the relevant candle window.
Dynamic Identification: The indicator uses the built-in Pine Script variables:
bar_index: Represents the index of the currently processed candle (starting at 0).
last_bar_index: Represents the index of the very last available candle in your chart (the most recent).
Precise Marking: The core logic bar_index == last_bar_index - num_candles_to_mark + 1 calculates the exact index of the candle that is 20 bars before the last_bar_index . If the bar_index of the currently processed candle matches this calculated position, that specific candle is colored blue with 80% transparency.
Automatic Shift: As new candles appear on your chart (and last_bar_index increases accordingly), the calculated target index ( last_bar_index - num_candles_to_mark + 1 ) also automatically shifts one bar to the right. This ensures that the marked candle automatically "moves along" and always highlights the first candle of the current 20-candle window.
Usage:
This indicator is useful for traders who want to visually track the starting point of a fixed window of recent price action. It can help identify patterns or apply strategies relative to that specific candle.
To use it, simply copy the provided Pine Script code into your TradingView Pine Editor and add it to your chart. The marked candle will dynamically update as new data arrives.

Custom Time Volume Profile [Fixed]Made it for auto draw VP on chart everyday .
Such as :
Previous Day VAH/POC/VAL
Previous Week VAH/POC/VAL
Current Session VAH/POC/VAL
Also can custom the time , colour .

Zero Lag MACD + Kijun-sen + EOM StrategyThis strategy offers a robust approach to identifying high-probability trading opportunities in the fast-paced cryptocurrency markets, particularly on lower timeframes (e.g., 5-minute). It leverages the synergistic power of three distinct indicators to confirm entries, ensuring a disciplined approach to risk management.
Key Components:
Zero Lag MACD Enhanced Version 1.2: This core momentum indicator is used to identify precise shifts in trend and momentum, offering reduced lag compared to traditional MACD. Entry signals are filtered based on the histogram's position (below for buys, above for sells) to enhance signal reliability.
Kijun-sen (Ichimoku Cloud): Acting as a dynamic /resistance and trend filter, the Kijun-sen line confirms the prevailing market direction. Long entries are confirmed when price is above Kijun-sen, and short entries when price is below.
Ease of Movement (EoM): This volume-based oscillator provides crucial confirmation of price movements by measuring the ease with which price changes. Positive EoM confirms buying pressure, while negative confirms selling pressure, adding an essential layer of validation to trade setups.
How it Works:
The strategy generates entry signals only when all three indicators align simultaneously:
For Long Entries: A Zero Lag MACD buy signal (crossover below histogram) must coincide with price trading above the Kijun-sen, and the Ease of Movement indicator being above its zero line.
For Short Entries: A Zero Lag MACD sell signal (crossover above histogram) must coincide with price trading below the Kijun-sen, and the Ease of Movement indicator being below its zero line.
Entries are executed at the open of the candle immediately following the signal confirmation.
Risk Management:
Disciplined risk management is paramount to this strategy:
Dynamic Stop-Loss: An Average True Range (ATR) based stop-loss is implemented, set at 2.5 times the current ATR. This adapts the stop-loss distance to market volatility, ensuring sensible risk sizing.
Fixed Take-Profit: A consistent Risk-to-Reward (R:R) ratio of 1:1.2 is applied for all trades, promoting stable profit realization.
Customization & Optimization:
The strategy is built with fully customizable input parameters for each indicator (MACD lengths, Kijun-sen period, ATR period, ATR multiplier, and Risk-to-Reward ratio). This allows s to fine-tune the strategy for different assets, timeframes, and market conditions, facilitating robust backtesting and optimization.
Disclaimer: Trading involves substantial risk and is not suitable for all investors. Past performance is not indicative of future results. This strategy is provided for educational and informational purposes only. Always use proper risk management and conduct your own due diligence.

Pivot Points StandardThis Pivot Points indicator calculates and plots pivot levels on your chart according to several popular methods (such as Traditional, Fibonacci, Woodie, Classic, Camarilla, etc.), helping traders identify key and resistance levels. Pivot points are essential tools for predicting market reversal points, and this indicator does so efficiently in real-time.
Features:
Pivot Calculation Methods: Traditional, Fibonacci, Woodie, Classic, Camarilla, and more.
Customization Options: Adjust the pivot type, number of visible pivots, and other parameters like line color and thickness.
Custom Alerts: Receive automatic alerts when the price crosses any pivot level (S1, S2, R1, R2, etc.), helping you react quickly to potential market reversals.
Multiple Timeframe : Set the timeframe for the pivot calculations and view corresponding pivot levels for that period.
Visible Pivot Levels: Choose to show or hide the pivot levels directly on the chart, with the option to display the exact price of each level.
Flexible Label Positioning: Select whether pivot labels should appear on the left or right side of the pivot line.
Benefits:
Facilitates Decision-Making: Pivot levels help identify key zones where price is likely to reverse or stay within a range.
Real-Time Alerts: Alerts notify you as soon as the price crosses any key pivot level, enabling you to make quick and precise decisions without constantly monitoring the chart.
Customization: Easily adjust the indicator to suit your trading style and visual preferences.
Ideal For:
Traders looking for technical analysis tools to identify key market levels.
Those who want to receive automatic alerts about pivot level crossovers to streamline decision-making.
Investors using pivot analysis in their trading strategy to determine entry or exit points.

HA EMA Cross MTF Strategy + ATR SL/TP + Visuals📜 Strategy Description: HA EMA Cross MTF Strategy + ATR SL/TP + Visuals
Hello Traders,
This is a multi-timeframe, Heikin Ashi-based trend-following strategy that integrates EMA crossovers and ATR-driven exits. The goal is to filter out noise, confirm directional bias using higher timeframe structure, and manage risk through volatility-adaptive exits.
🔍 How the Strategy Works
* Heikin Ashi candles help smooth out minor price fluctuations, allowing for clearer trend detection.
* A Fast EMA crossing above or below a Slow EMA determines the local trend bias.
* A Higher Timeframe Heikin Ashi confirmation is used to validate entries only when both timeframes agree in direction.
* Session filters can restrict trading to custom hours (e.g., U.S. market open).
⚙️ Risk Management Features
This strategy includes optional ATR-based Stop-Loss and Take-Profit logic, designed to adapt dynamically to market volatility:
* ATR Stop-Loss: Based on a -defined multiplier (default: 1.5×ATR)
* ATR Take-Profit: Based on a separate multiplier (default: 2.5×ATR)
* s can toggle this logic on/off and customize ATR length and multipliers in the settings.
📊 Visual Aids Included
To help understand market behavior and trade execution visually, the script includes:
* Entry arrows (long and short)
* Real-time Fast EMA / Slow EMA overlays
* Stop-Loss / Take-Profit level plots
* Optional Heikin Ashi Close line for trend visualization
🔧 Customization Parameters
s can adjust:
* EMA periods (fast and slow)
* ATR period and multipliers for SL/TP
* Session time filters
* Higher timeframe input
* Toggle ATR logic and visual overlays
🧪 Backtest Defaults (for reference only)
* Initial Capital: $10,000
* Order Size: 100% of equity
* Slippage: 1 tick
* Commission: 0.075%
* Recommended Timeframe: 1H or 15min
* Minimum Trades Suggested: 100+
* All these values can be adjusted in the strategy settings .
⚠️ Disclaimer
This strategy is provided for educational and research purposes only. It does not constitute financial advice, nor does it guarantee future performance. Please forward-test and adapt to your own risk tolerance before using in live trading.
This strategy is fully open-source and editable. Feel free to customize it for your use case and timeframes.

Multi-Timeframe Price Action AnalysisMulti-Timeframe Price Action Analysis
This indicator analyzes price action across multiple timeframes to determine bullish and bearish signals. It creates a dashboard showing how price interacts with previous candles' highs and lows.
Features
- Analyzes 4 customizable timeframes simultaneously
- Detects when price:
-- Grabs lows and comes back inside (bullish)
-- Grabs highs and comes back inside (bearish)
-- Grabs both highs and lows
-- Moves above previous high
-- Moves below previous low
-- Calculates bullish/bearish percentages for each timeframe
-- Visual dashboard with color-coded signals
Adjustable confirmation settings
-- Settings
-- Customize timeframes (default: 15min, 1H, 4H, D)
-- Toggle confirmation waiting
-- Set number of confirmation candles
This is a very rudimentary version.. I will make a more robust version soon
For it to be considered a "grab" the current price must be within the previous candle's range..
This also does not focus on candle closures just highs and lows
Also note that this is a little aggressive in that it does not require a bullish close for example to be considered bullish, a bearish close inside the previous candle is considered valid, this is to handle the morning stars that have a slightly bearish close in middle candle etc.. obviously do not rely on this indicator.. look at the price action and determine if you think its worth taking..
Same goes for bullish closes inside previous candle after grabbing highs..

Death Cross & Golden CrossDeath Cross & Golden Cross
When Short term (Red) EMA crosses Long term EMA singals a Buy/Sell. When the reverses sqaure off the trade.

M2 GLI SD BandsHighly customizable M2 Global Liquidity Index with adaptive standard deviation bands.
The SD bands incorporate data from M2 with varying lags to capture M2's full impact on the price of Bitcoin spread across multiple weeks.
EMAs are used for smoothing. Offset, smoothing, and other features are customizable.


Institutional Key Levels + VWAP Alerts (Labeled)🧠 Description:
This free version of the Institutional Key Levels + VWAP script gives you instant, auto-updating visibility on the most important price zones for intraday and swing trading.
✅ Designed for traders who want clean, data-driven levels without daily redrawing.
🧱 What It Shows:
Prior Day High (PDH)
Prior Day Low (PDL)
Prior Day Close (PDC)
Live VWAP
Color-coded horizontal lines + optional chart labels
Built-in alert conditions for:
Breakout above PDH
Breakdown below PDL
VWAP Reclaim or Rejection
📊 Ideal for:
Futures traders (MNQ, ES, MGC, etc.)
Equity scalpers
Options traders using directional bias
Traders who use VWAP as a dynamic S/R guide
🔧 No need to draw lines manually. This script updates daily with zero maintenance and lets you stay focused on execution.

SMA Strategy with Re-Entry Signal (v6 Style)*SMA Trend Strategy with Re-Entry Signal (v6 Edition)*
This indicator is based on a classic moving average trend-following system, enhanced with re-entry signals designed for medium to short-term traders.
---
### 📈 Key Features:
1. *Trend Detection Logic:*
- The 30-period SMA (SMA30) is used as the trend filter.
- When the closing price is above the SMA30, the market is considered to be in an uptrend.
2. *Re-Entry Signal:*
- While in an uptrend, if the closing price crosses above the SMA20, a re-entry (add position) signal is triggered.
- These signals are shown with green upward arrows below the bars.
3. *Background Highlighting:*
- Green background: indicates an uptrend.
- Red background: indicates a break below SMA30, suggesting weakening momentum.
4. *Multi-SMA Visualization:*
- Five SMAs are displayed: SMA10, SMA20, SMA30, SMA60, and SMA250.
- This helps visualize both short-term and long-term trend structures.
---
### 🔍 Usage Tips:
- Use this script directly on your main chart to monitor trend direction and wait for re-entry signals during pullbacks.
- Combine with other tools like volume, price action, or candlestick patterns to confirm entries.
---
### ⚠️ Disclaimer:
- This indicator is for educational and informational purposes only. It does not constitute financial advice or a buy/sell signal.
- Avoid relying solely on this script for trading decisions. Always manage your own risk.
---
👨💻 *Developer’s Note:*
This script is 100% manually developed, not copied or auto-generated. It is an original implementation based on my personal trading logic. Suggestions and are welcome!

Candle Ribbon [UkutaLabs]The Candle Ribbon is a powerful trading tool that creates a strong ribbon that indicates market strength. This ribbon is created using three moving averages that use the candle values (high, low, open and close) as its input values.
The center most MA will also be colored green, red or grey depending on whether or not its direction aligns with current market strength.
The outer band lines act as range indicators, plotted above and below the center ribbon, which represent volatility boundaries for price action.
█ USAGE
The Candle Ribbon is created using a series of three moving averages that uses values from the candle as its inputs. The has the ability to select whether the moving averages are EMAs or SMAs, as well as the ability to control the period of the moving averages.
If the moving average calculated using the Candle Open is below the moving average calculated using the Candle Close, the ribbon will be colored green, indicating a bullish trend. If the moving average calculated using the Candle Open is above the moving average calculated using the Candle Open, the ribbon will be colored red, indicating a bearish trend.
This indicator also uses a series of hidden EMAs to determine market strength. If these EMAs do not align with the direction of the Candle Ribbon, the middle MA will instead be colored grey, indicating uncertainty in the market, as well as a possible reversal.
█ SETTINGS
Configuration
• Moving Average Type: Determines whether or not the Candle Moving Averages will be drawn as EMAs or SMAs.
• Moving Average Period: Determines the period of the Candle Moving Averages.
Moving Average
• Moving Average Input: Determines the input values for the hidden EMAs.

RSI + Bollinger Reversal AlertRSI + Bollinger Reversal Alert
Good win rate backtest on this strategy allow you to find nice entry with RSI + Bollinger Reversal Alert confluence

Global M2 Money Supply // Days Offset =The script still runs on any chart.
The line only appears on BTC charts.
It avoids all errors with the display argument.

Oculus Ultra Parallel S/R Channel**Oculus Ultra Parallel S/R Channel**
*Version 1.0 | Pine Script v6*
**Overview**
This indicator overlays a statistically-driven /resistance channel on your chart by fitting a linear regression (median) line and plotting parallel bands at a configurable multiple of standard deviation. It adapts dynamically to both trend and volatility, highlights potential reaction zones, and offers optional alerts when price touches key levels.
**Key Features**
* **Median Regression Line**
Fits a best-fit line through the chosen lookback of price data, showing the underlying trend.
* **Volatility-Based Bands**
Upper and lower bands offset by *N*× standard deviation of regression residuals, capturing dynamic S/R zones.
* **Dynamic Coloring**
* Median line turns **teal** when sloping up, **orange** when sloping down.
* Bands tinted green or red depending on their position relative to the median.
* **Channel Fill**
Optional shaded area between the bands for immediate visual context.
* **Touch Alerts**
Precision alerts and on-chart markers when price touches the or resistance band, with configurable tick tolerance.
* **Clean Layout**
Minimal lines and plots to avoid chart clutter, adjustable via toggle inputs.
**How to Use**
1. **Apply the Script** – Add to any timeframe in overlay mode.
2. **Configure Inputs** –
* **Channel Length**: Number of bars for regression and volatility calculation.
* **Deviation Factor**: Multiplier for band width (in standard deviations).
* **Show/Hide Elements**: Toggle median line, bands, fill, and touch alerts.
* **Color by Slope**: Enable slope-based median coloring.
* **Touch Tolerance**: Number of ticks within which a band touch is ed.
3. **Interpret the Channel** –
* **Trend**: Follow the slope and color of the median line.
* **/Resistance**: Bands represent dynamic zones where price often reacts.
* **Alerts**: Use touch markers or alert pop-ups to time entries or exits at band levels.
**Inputs**
* **Channel Length** (default: 100)
* **Deviation Factor** (default: 1.0)
* **Show Median Regression Line** (true/false)
* **Show Channel Bands** (true/false)
* **Fill Between Bands** (true/false)
* **Color Median by Slope** (true/false)
* **Alert on Band Touch** (true/false)
* **Touch Tolerance (ticks)** (default: 2)
**Version History**
* **1.0** – Initial release with dynamic regression channel, slope coloring, band fill, and touch alerts.
**Disclaimer**
This indicator is intended for educational purposes. Always backtest with your own settings and apply sound risk management before trading live.

EMAJAYmultiple ema to set on the chart. easy to save on one indicator. able to be use for light subs.
