Indicadores y estrategias


Momentum Trend Bands (MTB)📌 What Is the Momentum Trend Bands (MTB) Indicator?
The Momentum Trend Bands (MTB) is a custom-built trend detection indicator that blends momentum and volatility into a dynamic, visual system. Its core goal is to help traders identify the beginning and strength of a trend earlier than traditional tools like moving averages, while filtering out market noise.
🧠 What Is It Built On?
The indicator is built on two foundational concepts:
1. Rate of Change (ROC): This measures the speed at which the price is moving. We use a fast and a slow version of ROC and then calculate their difference. This difference gives us a momentum signal — it shows whether the price is gaining upward or downward strength.
2. Standard Deviation (Volatility): This shows how much the price fluctuates. By calculating it over a certain period, we can measure market noise and filter out weak, insignificant moves that might otherwise cause false signals.
Together, momentum shows direction, and volatility shows confidence.
🛠️ How Does It Work?
• The core of the indicator is a smoothed momentum signal, representing the net difference between fast and slow momentum.
• Around this signal, we build upper and lower bands — these are dynamic boundaries that expand or contract based on volatility.
• When the momentum breaks above or below these bands, it signals a strong directional move — suggesting the start or continuation of a trend.
The bands also serve a visual filter:
• If momentum stays within the bands, it implies the market is consolidating or ranging.
• When it exits the bands decisively, it implies strength in that direction.
📈 How to Use It?
1. Trend Entry:
o When the momentum signal rises above the upper band, it suggests a strong bullish trend may be starting.
o When the signal drops below the lower band, it indicates a bearish trend.
2. Stay Out of Chop:
o If the signal moves sideways within the bands, it’s best to avoid trading — the market is likely consolidating or ranging.
3. Visual Confirmation:
o The background color changes with the trend: green for bullish, red for bearish, gray for neutral. This makes it quick to read visually.
4. Signal Arrows:
o Small up or down arrows appear when trends begin, serving as early entry points.
⚙️ What Kind of Market Does It Work Best In?
• Trending Markets: MTB shines in markets with strong directional movement — whether up or down. It's designed to pick up momentum early and hold through trend continuation.
• Volatile Instruments: The built-in volatility filter helps in markets like crypto or commodities where price action is fast and erratic.
• Avoid Flat or Low-Volume Conditions: In sideways markets, MTB may stay gray or flip often — these are not ideal times to trade using this indicator alone.
💎 Why Is It Unique?
Unlike many indicators that react slowly (like moving averages) or trigger too often (like raw momentum), MTB balances early detection with reliability. Its unique combination of:
• ROC difference for directional intent,
• Smoothing for signal clarity,
• Bands scaled by volatility for robustness,
…makes it stand apart from commonly available indicators on platforms like TradingView.

VWAP + ADX Trend FilterVWAP + ADX Trend Identifier (Intraday)”
🔹 Description:
Write a short, clear summary like:
“This script combines VWAP and ADX to help identify intraday trend trades. Buy and sell signals appear when price crosses VWAP with ADX strength above a threshold, confirming directional bias.”
You can also include:
Best suited for NIFTY / BNIFTY
Ideal timeframe: 5–15 min
For educational or personal use
🔹 Visibility:
Public: Anyone can find it on TradingView. Must follow Pine Script Publishing Rules.
Invite-only: Useful if you want to share with selected people (like clients or s).
Private: Only you can see and use it.
📌 Important Tips for Publishing:

Clean /Resistance Rejection (Strict Filtering)Best buy and Sell signal based on and resistance levels.
You can edit how many candle rejections you want after rejection on each level.
Enjoy!

MA20 / MA40 / MA100 / MA200LAchi1911@ MA20_MA100
Medias moviles en todos los periodos pra identificar tendencias

Breakout Strategy with EMA & VolumeA breakout strategy combined with EMA and Volume data to give you the best results.
Indicator includes:
EMA 20 and EMA 50
Volume indicator
RSI (14)

SDCALibraryMy Valuation Library for mostly crypto currency use, but some can be applied to other assets.
There are technical and on-chain indicator functions for use.
Technical Indicators:
1. **drawdown_zscore**
- **Summary**: Calculates the z-score of drawdowns over a specified lookback period.
- **Inputs**:
- `lookback_length` (int): Period for drawdown calculation.
- `zScoreLen` (int): Length for z-score calculation.
2. **sharpe_zscore**
- **Summary**: Computes the z-score of the Sharpe ratio using returns over a period and a smoothing length.
- **Inputs**:
- `length` (int): Period for returns calculation.
- `smalen` (int): Smoothing length for returns.
- `zScoreLen` (int): Length for z-score calculation.
3. **rsi_zscore**
- **Summary**: Calculates the z-score of the Relative Strength Index (RSI) with smoothing.
- **Inputs**:
- `length` (int): Period for RSI calculation.
- `smalen` (int): Smoothing length for RSI.
- `zScoreLen` (int): Length for z-score calculation.
4. **DFATH_zscore**
- **Summary**: Computes the z-score for a specific DFATH metric (details not specified).
- **Inputs**:
- `zScoreLen` (int): Length for z-score calculation.
5. **RTI_zscore**
- **Summary**: Calculates the z-score of a trend indicator based on data count and sensitivity.
- **Inputs**:
- `trend_data_count` (int): Number of data points for trend analysis.
- `trend_sensitivity_percentage` (int): Sensitivity threshold for trend detection.
- `zScoreLen` (int): Length for z-score calculation.
On-Chain (Crypto only, mostly BTC, ETH)
6. **SOPR_zscore**
- **Summary**: Computes the z-score of Spent Output Profit Ratio (SOPR) for a specific coin.
- **Inputs**:
- `zScoreLen` (int): Length for z-score calculation.
- `coin_sopr` (string): SOPR data for the specified coin.
7. **thermocap_zscore**
- **Summary**: Calculates the z-score of the Thermocap metric using moving average and coin-specific data.
- **Inputs**:
- `ma_len` (int): Length of the moving average.
- `ma_type` (string): Type of moving average.
- `zScoreLen` (int): Length for z-score calculation.
- `coin_index` (string): Coin index data.
- `coin_blocks_mined` (string): Data on blocks mined for the coin.
8. **MVRV_zscore**
- **Summary**: Computes the z-score of the Market Value to Realized Value (MVRV) ratio.
- **Inputs**:
- `zScoreLen` (int): Length for z-score calculation.
- `coin_MC` (string): Market capitalization data.
- `coin_MC_real` (string): Realized market capitalization data.
9. **supplyinprofit_zscore**
- **Summary**: Calculates the z-score of the percentage of coin supply in profit or loss, optionally adjusted for alpha decay.
- **Inputs**:
- `isAlphaDecayAdjusted` (bool): Whether to apply alpha decay adjustment.
- `zScoreLen` (int): Length for z-score calculation.
- `coin_profit_address_percent` (string): Percentage of addresses in profit.
- `coin_loss_address_percent` (string): Percentage of addresses in loss.
10. **realized_price_zscore**
- **Summary**: Computes the z-score of the realized price based on realized market cap and supply.
- **Inputs**:
- `zScoreLen` (int): Length for z-score calculation.
- `coin_MC_real` (string): Realized market capitalization data.
- `coin_supply` (string): Coin supply data.
11. **CVVD_zscore**
- **Summary**: Calculates the z-score of Cumulative Value Days Destroyed (CVVD) metric.
- **Inputs**:
- `zScoreLen` (int): Length for z-score calculation.
- `coin_MC_real` (string): Realized market capitalization data.
- `coin_total_volume` (string): Total volume data for the coin.
12. **NUPL_zscore**
- **Summary**: Computes the z-score of Net Unrealized Profit and Loss (NUPL) metric.
- **Inputs**:
- `zScoreLen` (int): Length for z-score calculation.
- `coin_MC` (string): Market capitalization data.
- `coin_MC_real` (string): Realized market capitalization data.

Moving AveragesThis indicator allows you to seamlessly apply one or multiple moving averages simultaneously on your chart. You can easily select from predefined periods: 10, 20, 50, 100, and 200.
It is pre-configured to use Exponential Moving Averages (EMA) by default, so there’s no need to input or adjust the type manually—just enable the ones you need and you're ready to go.
Ideal for traders who rely on dynamic trend analysis and want a quick, clutter-free setup for multiple EMAs

Average True Range (50%)This script is used to calculate and display the Average True Range (ATR) scaled down to 50% of its original value. ATR is a volatility indicator that measures how much the price of an asset moves within a certain period. This script allows s to choose a smoothing method to calculate the ATR, including RMA, SMA, EMA, or WMA.

Simple Position CalculatorThis indicator provides a real-time position sizing calculator designed for fast momentum trading. It instantly calculates optimal trade size based on your risk parameters, entry/exit prices, and exchange conditions (fees/slippage). Perfect for high-speed entries during candle closes and breakouts.

Double Inside Bar Alert (1-1 Only)Double Inside Bar Alert Indicator
Stay ahead of breakout opportunities with our Double Inside Bar Alert Indicator. This tool automatically scans your watchlist and notifies you in real-time whenever a double inside bar pattern appears—an advanced price action setup known for signaling strong potential breakouts or reversals.
Whether you’re a day trader or swing trader, this indicator helps you:
Spot consolidation zones early before major price moves
Receive instant alerts across your entire watchlist
Filter noise and focus on high-probability chart setups
Perfect for traders who rely on price action and want to catch momentum shifts as they form.

Choppiness ZONE OverlayPurpose
This script overlays choppiness zones directly onto the price chart to help traders identify whether the market is trending or ranging. It is designed to filter out low-probability trades during high choppiness conditions.
How It Works
Calculates the Choppiness Index over a -defined period using ATR and price range.
Divides choppiness into four zones:
30 to 40: Low choppiness, possible trend initiation, shown in yellow.
40 to 50: Moderate choppiness, transition zone, shown in orange.
50 to 60: High choppiness, weakening momentum, shown in red.
60 and above: Extreme choppiness, avoid trading, shown in purple.
Highlights each zone with customizable color fills between the high and low of the selected range.
Triggers a real-time alert when choppiness exceeds 60.
Features
Customizable choppiness zones and color settings.
Real-time alert when market becomes extremely choppy (choppiness ≥ 60).
Visual zone overlay on the price chart.
Compatible with all timeframes.
Lightweight and responsive for scalping, intraday, or swing trading.
Tip
Use this tool as a volatility or trend filter. Combine it with momentum or trend-following indicators to improve trade selection.

MA Cross MTF Alert (Miu)This script extends the classic moving average crossover strategy with for up to 8 -defined symbols across 4 custom timeframes, combined with a visual and alert system designed for traders who monitor multiple assets simultaneously.
Unlike traditional MA crossover tools, this script enables traders to receive real-time alerts for crossovers across multiple assets and timeframes, even when the script is not actively displayed on the chart — ideal for ive monitoring in multi-asset strategies.
What it does:
This script calculates two customizable moving averages (SMA or EMA) for each selected symbol and timeframe.
It then tracks crossover events:
- Bullish crossover when the fast MA crosses above the slow MA
- Bearish crossunder when the fast MA crosses below the slow MA
On the chart, it also displays the crossover signals for the current symbol and timeframe using color-coded cross icons.
Key features:
- Select SMA or EMA type for both moving averages
- Customize MA lengths and colors
- Works with any asset and timeframe
- Alerts include symbol and timeframe info for easy identification
How to use:
1) Add the indicator to your chart.
2) Choose the moving average type and lengths.
3) Enable/disable any of the 8 symbols and 4 timeframes.
4) Set up TradingView alerts by clicking “Create Alert” and selecting one of the alert() calls.
5) You will receive a message like:
BTC (1h) | MA Crossover ▲ or ETH (15m) | MA Crossunder ▼
Technical note:
This script uses request.security() to retrieve moving average values from up to 8 different symbols and 4 different timeframes in real time.
Feel free to leave your or suggestions in the comments section below.
Enjoy!

Avions Ultimate indicator70% wr backtest it yourself. works best on bitcoin 30m timeframe works the best for me

DrawZigZag🟩 OVERVIEW
This library draws zigzag lines for existing pivots. It is designed to be simple to use. If your script creates pivots and you want to them up while handling edge cases, this library does that quickly and efficiently. If you want your pivots created for you, choose one of the many other zigzag libraries that do that.
🟩 HOW TO USE
Pine Script libraries contain reusable code for importing into indicators. You do not need to copy any code out of here. Just import the library and call the function you want.
For example, for version 1 of this library, import it like this:
import SimpleCryptoLife/DrawZigZag/1
See the EXAMPLE USAGE sections within the library for examples of calling the functions.
For more information on libraries and incorporating them into your scripts, see the Libraries section of the Pine Script Manual.
🟩 WHAT IT DOES
I looked at every zigzag library on TradingView, after finishing this one. They all seemed to fall into two groups in of functionality:
• Create the pivots themselves, using a combination of Williams-style pivots and sometimes price distance.
• Require an array of pivot information, often in a format that uses -defined types.
My library takes a completely different approach.
Firstly, it only does the drawing. It doesn't calculate the pivots for you. This isn't laziness. There are so many ways to define pivots and that should be up to you. If you've followed my work on market structure you know what I think of Williams pivots.
Secondly, when you information about your pivots to the library function, you only need the minimum of pivot information -- whether it's a High or Low pivot, the price, and the bar index. these as normal variables -- bools, ints, and floats -- on the fly as your pivots confirm. It is completely agnostic as to how you derive your pivots. If they are confirmed an arbitrary number of bars after they happen, that's fine.
So why even bother using it if all it does it draw some lines?
Turns out there is quite some logic needed in order to connect highs and lows in the right way, and to handle edge cases. This is the kind of thing one can happily outsource.
🟩 THE RULES
• Zigs and zags must alternate between Highs and Lows. We never connect a High to a High or a Low to a Low.
• If a candle has both a High and Low pivot confirmed on it, the first line is drawn to the end of the candle that is the opposite to the previous pivot. Then the next line goes vertically through the candle to the other end, and then after that continues normally.
• If we draw a line up from a Low to a High pivot, and another High pivot comes in higher, we *extend* the line up, and the same for lines down. Yes this is a form of repainting. It is in my opinion the only way to end up with a correct structure.
• We ignore lower highs on the way up and higher lows on the way down.
🟩 WHAT'S COOL ABOUT THIS LIBRARY
• It's simple and lightweight: no exported -defined types, no helper methods, no matrices.
• It's really fast. In my profiling it runs at about ~50ms, and changing the options (e.g., trimming the array) doesn't make very much difference.
• You only need to call one function, which does all the calculations and draws all lines.
• There are two variations of this function though -- one simple function that just draws lines, and one slightly more advanced method that modifies an array containing the lines. If you don't know which one you want, use the simpler one.
🟩 GEEK STUFF
• There are no dependencies on other libraries.
• I tried to make the logic as clear as I could and comment it appropriately.
• In the `f_drawZigZags` function, the line variable is declared using the `var` keyword *inside* the function, for simplicity. For this reason, it persists between function calls *only* if the function is called from the global scope or a local if block. In general, if a function is called from inside a loop , or multiple times from different contexts, persistent variables inside that function are re-initialised on each call. In this case, this re-initialisation would mean that the function loses track of the previous line, resulting in incorrect drawings. This is why you cannot call the `f_drawZigZags` function from a loop (not that there's any reason to). The `m_drawZigZagsArray` does not use any internal `var` variables.
• The function itself takes a Boolean parameter `_showZigZag`, which turns the drawings on and off, so there is no need to call the function conditionally. In the examples, we do call the functions from an if block, purely as an illustration of how to increase performance by restricting the amount of code that needs to be run.
🟩 BRING ON THE FUNCTIONS
f_drawZigZags(_showZigZag, _isHighPivot, _isLowPivot, _highPivotPrice, _lowPivotPrice, _pivotIndex, _zigzagWidth, _lineStyle, _upZigColour, _downZagColour)
This function creates or extends the latest zigzag line. Takes real-time information about pivots and draws lines. It does not calculate the pivots. It must be called once per script and cannot be called from a loop.
Parameters:
_showZigZag (bool) : Whether to show the zigzag lines.
_isHighPivot (bool) : Whether the current bar confirms a high pivot. Note that pivots are confirmed after the bar in which they occur.
_isLowPivot (bool) : Whether the current bar confirms a low pivot.
_highPivotPrice (float) : The price of the high pivot that was confirmed this bar. It is NOT the high price of the current bar.
_lowPivotPrice (float) : The price of the low pivot that was confirmed this bar. It is NOT the low price of the current bar.
_pivotIndex (int) : The bar index of the pivot that was confirmed this bar. This is not an offset. It's the `bar_index` value of the pivot.
_zigzagWidth (int) : The width of the zigzag lines.
_lineStyle (string) : The style of the zigzag lines.
_upZigColour (color) : The colour of the up zigzag lines.
_downZagColour (color) : The colour of the down zigzag lines.
Returns: The function has no explicit returns. As a side effect, it draws or updates zigzag lines.
method m_drawZigZagsArray(_a_zigZagLines, _showZigZag, _isHighPivot, _isLowPivot, _highPivotPrice, _lowPivotPrice, _pivotIndex, _zigzagWidth, _lineStyle, _upZigColour, _downZagColour, _trimArray)
Namespace types: array
Parameters:
_a_zigZagLines (array)
_showZigZag (bool) : Whether to show the zigzag lines.
_isHighPivot (bool) : Whether the current bar confirms a high pivot. Note that pivots are usually confirmed after the bar in which they occur.
_isLowPivot (bool) : Whether the current bar confirms a low pivot.
_highPivotPrice (float) : The price of the high pivot that was confirmed this bar. It is NOT the high price of the current bar.
_lowPivotPrice (float) : The price of the low pivot that was confirmed this bar. It is NOT the low price of the current bar.
_pivotIndex (int) : The bar index of the pivot that was confirmed this bar. This is not an offset. It's the `bar_index` value of the pivot.
_zigzagWidth (int) : The width of the zigzag lines.
_lineStyle (string) : The style of the zigzag lines.
_upZigColour (color) : The colour of the up zigzag lines.
_downZagColour (color) : The colour of the down zigzag lines.
_trimArray (bool) : If true, the array of lines is kept to a maximum size of two lines (the line elements are not deleted). If false (the default), the array is kept to a maximum of 500 lines (the maximum number of line objects a single Pine script can display).
Returns: This function has no explicit returns but it modifies a global array of zigzag lines.

ATR, ADX, RSI TableATR, ADX & RSI Dashboard (Color-Coded)
Overview
This indicator provides a clean, all-in-one dashboard that displays the current values for three of the most popular technical indicators: Average True Range (ATR), Average Directional Index (ADX), and Relative Strength Index (RSI).
To make analysis faster and more intuitive, the values in the table are dynamically color-coded based on key thresholds. This allows you to get an immediate visual summary of market volatility, trend strength, and momentum without cluttering your main chart area.
Features
The indicator displays a simple table in the bottom-right corner of your chart with the following color logic:
ATR (Volatility): Measures the average volatility of an asset.
Green: Low Volatility (ATR is less than 3% of the current price).
Orange: Moderate Volatility (ATR is between 3% and 5%).
Red: High Volatility (ATR is greater than 5%).
ADX (Trend Strength): Measures the strength of the underlying trend, regardless of its direction.
Red: Weak or Non-Trending Market (ADX is below 20).
Orange: Developing or Neutral Trend (ADX is between 20 and 25).
Green: Strong Trend (ADX is above 25).
RSI (Momentum): Measures the speed and change of price movements to identify overbought or oversold conditions.
Green: Potentially Oversold (RSI is below 40).
Orange: Neutral/Normal Conditions (RSI is between 40 and 70).
Red: Potentially Overbought (RSI is above 70).
How to Use
This tool is perfect for traders who want a quick, at-a-glance understanding of the current market state. Instead of analyzing three separate indicators, you can use this dashboard to:
Quickly confirm if a strong trend is present before entering a trade.
Assess volatility to adjust your stop-loss and take-profit levels.
Instantly spot potential overbought or oversold conditions.
Customization
All input lengths for the ATR, ADX, and RSI are fully customizable in the indicator's settings menu, allowing you to tailor the calculations to your specific trading style and timeframe.

Auto-Trend Finder (Pivot + ADX)Inspired in part by LuxAlgo Trendlines with Breaks. Extended and enhanced for directional clarity and pivot-based precision.
🔍 What It Does
The Auto-Trend Finder (Pivot + ADX) is a smart trend-detection toolkit that combines:
Pivot-based swing detection (HH, HL, LH, LL)
ADX-filtered trendline projections
Custom slope estimation using ATR, Standard Deviation, Linear Regression, or a blended approach
Candlestick pattern detection for added confirmation (e.g., hammer, engulfing, shooting star)
📈 How It Works
1. Swing Detection
Uses ta.pivothigh / ta.pivotlow to mark major price turning points.
Labels pivots as Higher High (HH), Lower High (LH), Lower Low (LL), or Higher Low (HL).
Optionally overlays basic candle pattern names for visual context.
2. Trendline Logic
Connects successive pivot highs/lows with real-time trendlines.
Draws separate Uptrend and Downtrend lines with distinct colors.
3. Extended Projections
Projects extended dashed lines from the last pivot using slope formulas:
ATR-based (volatility)
Stdev-based (dispersion)
Linear Regression (trend best-fit)
Or a Combined slope using -defined weights.
Color changes dynamically on breakout to visually signal momentum shifts.
4. ADX Trend Strength Filter
Optional ADX filter disables trendline updates unless directional strength exceeds a threshold (e.g. 20+).
Helps remove noise in sideways markets.
⚠️ Important Notes
Backpainting Warning: This script includes a backpainting setting (backpaint) that may cause lines to appear "reliably predictive" in historical data. Backpainting does not repaint once the pivot is confirmed, but it still reflects a post-fact state. Use this feature cautiously in live trading decisions.
Reused Code Attribution: Extended trendline concept and breakout color logic were inspired by publicly available open-source versions of LuxAlgo's trendline logic. Credit is given in the script comments and here as required.
🛠️ How to Use It
Adjust Pivot Length for swing detection sensitivity.
Toggle ADX filtering on or off to avoid choppy signals.
Choose your preferred Slope Calculation Method.
Use candlestick labels as potential entry signals near trendline retests or breaks.
✅ Why This Is More Than a Mashup
This tool integrates several separate technical methods into one cohesive, customizable framework:
It’s not just combining indicators, it’s engineering synergy between them.
The slope and ADX filtering mechanics dynamically adjust to trend strength.
Candlestick confirmation and labeling give visual, real-time trade confidence.
It enhances open-source logic by adding modular slope options, ADX gating, pattern labeling, and control.
"Know the structure. Follow the strength. Trade with clarity. Auto-Trend Finder is your edge in the chaos."

Discount to Net Asset ValueOverview
This indicator helps investors and analysts identify when a company’s stock is trading below or above its intrinsic value. A persistent discount may highlight potential value opportunities, while a sustained could signal overvaluation or strong market sentiment. By visually shading the background and plotting the discount/ percentage, s can quickly screen for undervalued stocks, confirm fundamental research, and make more informed buy or sell decisions.
Usage
Calculates the Net Asset Value discount (or ) for any symbol.
By default the indicator uses the current chart symbol’s TOTAL_ASSETS, TOTAL_LIABILITIES, and TOTAL_SHARES_OUTSTANDING.
You can select another symbol by checking “Use Custom Symbol” and entering the ticker of the other symbol. This is useful for comparing the Discount to NAV across symbols.
Shows the percentage discount (or ) of market capitalization relative to net asset value.
Recommended timeframes: daily bars or higher.
Reporting Periods:
• FQ = Fiscal Quarter
• FY = Fiscal Year
• TTM = Trailing Twelve Months
Note: NAV is pulled on the chosen reporting period (FQ, FY, TTM).
By default the background is shaded red to illustrate a discount to NAV and green to illustrate a to NAV. This can be toggled in the settings.

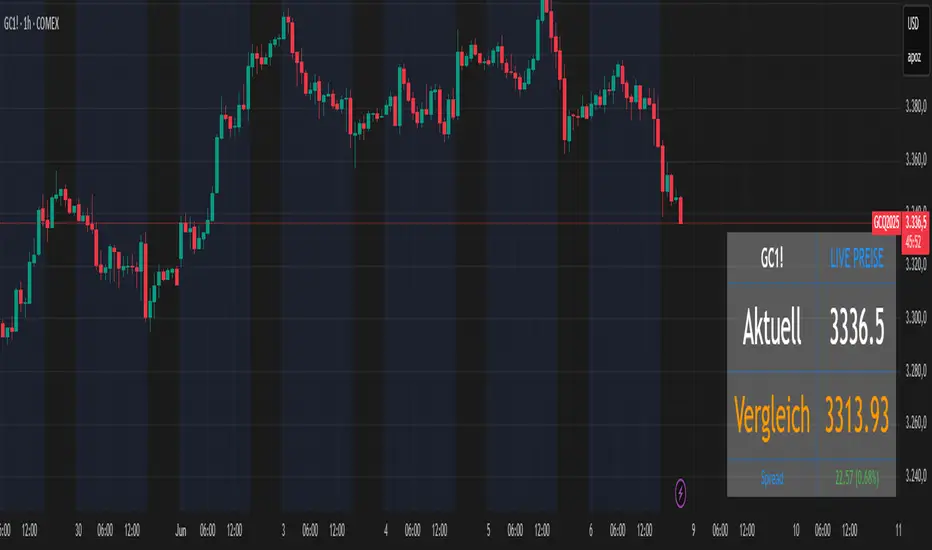
Futures vs CFD Price Display
🎯 Trading the same asset in CFDs and Futures but tired of switching charts to compare prices? This is your indicator!
Stop the constant chart hopping! This live price comparison shows you instantly where the better conditions are.
✨ What you get:
Bidirectional: Works in both Futures AND CFD charts
Live prices: Real-time comparison of both markets
Spread calculation: Automatic difference in points and percentage
Fully customizable: Colors, position, size to your liking
Professional design: Clean display with symbol header
🎯 Perfect for:
Gold traders (Futures vs CFD)
Arbitrage strategies
Spread monitoring
Multi-broker comparisons
⚙️ Customization:
3 sizes (Small/Normal/Large) for all screens
4 positions available
Individual color schemes
Toggle features on/off
💡 Simply enter the symbol and keep both markets in sight!
Notice: "Co-developed with Claude AI (Anthropic) - because even AI needs to pay the server bills! 😄"
Mariam Market DashboardMariam Market Dashboard – A Quick Guide
Purpose:
Shows if the market is trending, volatile, or stuck so you can decide when to trade or wait.
How to Use
Add the indicator to your chart. Adjust basic settings like EMA, RSI, ATR lengths, and timezone if needed. Use it before entering any trade to confirm market conditions.
What Each Metric Means (with general ranges)
Session: Identifies which market session is active (New York, London, Tokyo).
Trend: Shows current market direction. “Up” means price above EMA and VWAP, “Down” means price below. Use this to confirm bullish or bearish bias.
HTF Trend: Confirms trend on a higher timeframe for stronger signals.
ATR (Average True Range): Measures market volatility or price movement speed.
Low ATR (e.g., below 0.5% of price) means quiet or slow market; high ATR (above 1% of price) means volatile or fast-moving market, good for active trades.
Strong Bar: A candlestick closing near its high (above 75% of range) indicates strong buying momentum; closing near its low indicates strong selling momentum.
Higher Volume: Volume higher than average (typically 10-20% above normal) means more market activity and stronger moves.
Volume / Avg Volume: Ratio above 1.2 (120%) shows volume is significantly higher than usual, signaling strong interest.
RVol % (Relative Volume %): Above 100% means volume is hotter than normal, increasing chances of strong moves; below 50% means low activity and possible indecision.
Delta: Difference between buying and selling volume (if available). A positive delta means buyers dominate; negative means sellers dominate.
ADX (Average Directional Index): Measures trend strength:
Below 20 means weak or no trend;
Above 25 means strong trend;
Between 20-25 is moderate trend.
RSI (Relative Strength Index): Momentum oscillator:
Below 30 = oversold (potential buy);
Above 70 = overbought (potential sell);
Between 40-60 means neutral momentum.
MACD: Confirms momentum direction:
Positive MACD histogram bars indicate bullish momentum;
Negative bars indicate bearish momentum.
Choppiness Index: Measures how much the market is ranging versus trending:
Above 60 = very choppy/sideways market;
Below 40 = trending market.
Consolidation: When true, price is stuck in a narrow range, signaling indecision. Avoid breakout trades during this.
Quick Trading Reminder
Trade only when the trend is clear and volume is above average. Avoid trading in low volume or choppy markets.

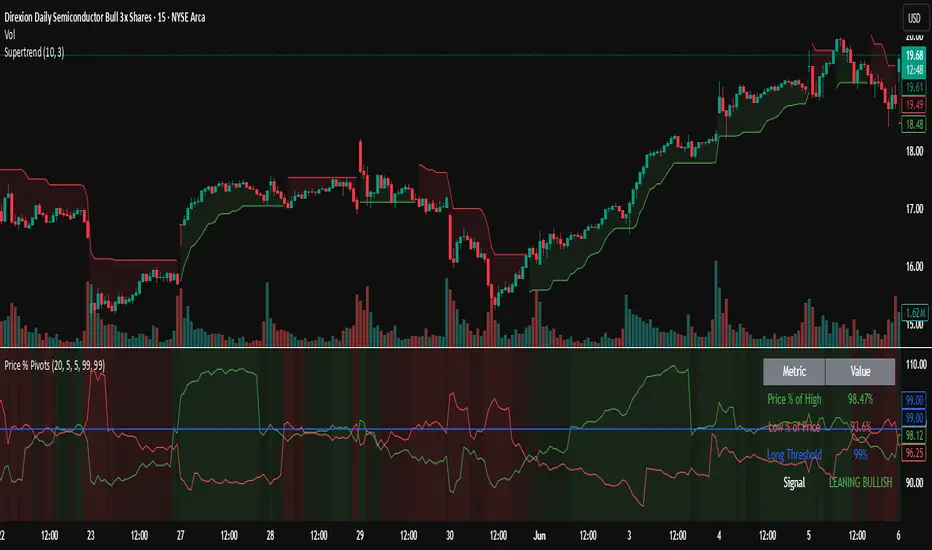
Trending Indicator: Price % of Pivots# Price % of Pivots Indicator
## Overview
A trend-following indicator that measures current price position relative to recent pivot highs and lows as percentages, providing normalized trend analysis across all timeframes and instruments.
## Key Features
- **Real-time trend table** with live signal updates (Strong Bullish/Bearish, Leaning Bullish/Bearish, Neutral)
- **Dual percentage tracking**: Price % of high pivot and low pivot % of current price
- **Universal compatibility** - works on any timeframe and asset class
- **Faster than some other trend indicators** - catches trend changes earlier with less lag
## Trading Signals
- **Bullish bias**: When price % of high pivot > low pivot % of price
- **Bearish bias**: When low pivot % of price > price % of high pivot
- **Customizable thresholds** (default 99%) with alert system
- **Color-coded backgrounds** for immediate visual confirmation
## Configuration
- Adjustable pivot lookback period (5-100 bars)
- Customizable left/right bars for pivot confirmation
- Threshold settings from 50-110% with 0.5% increments
- Full color customization for all elements
## Advantages
- **Speed**: More responsive than traditional ATR-based indicators
- **Clarity**: Clean percentage-based display with professional info table
- **Alerts**: Multiple conditions for automated and manual trading
- **Versatility**: Effective for day trading, swing trading, and multi-timeframe analysis
Perfect for traders seeking a fast, reliable trend indicator that works consistently across all markets and timeframes.
Bilateral Filter For Loop [BackQuant]Bilateral Filter For Loop
The Bilateral Filter For Loop is an advanced technical indicator designed to filter out market noise and smooth out price data, thus improving the identification of underlying market trends. It employs a bilateral filter, which is a sophisticated non-linear filter commonly used in image processing and price time series analysis. By considering both spatial and range differences between price points, this filter is highly effective at preserving significant trends while reducing random fluctuations, ultimately making it suitable for dynamic trend-following strategies.
Please take the time to read the following:
Key Features
1. Bilateral Filter Calculation:
The bilateral filter is the core of this indicator and works by applying a weight to each data point based on two factors: spatial distance and price range difference. This dual weighting process allows the filter to preserve important price movements while reducing the impact of less relevant fluctuations. The filter uses two primary parameters:
Spatial Sigma (σ_d): This parameter adjusts the weight applied based on the distance of each price point from the current price. A larger spatial sigma means more smoothing, as further away values will contribute more heavily to the result.
Range Sigma (σ_r): This parameter controls how much weight is applied based on the difference in price values. Larger price differences result in smaller weights, while similar price values result in larger weights, thereby preserving the trend while filtering out noise.
The output of this filter is a smoothed version of the original price series, which eliminates short-term fluctuations, helping traders focus on longer-term trends. The bilateral filter is applied over a rolling window, adjusting the level of smoothing dynamically based on both the distance between values and their relative price movements.
2. For Loop Calculation for Trend Scoring:
A for-loop is used to calculate the trend score based on the filtered price data. The loop compares the current value to previous values within the specified window, scoring the trend as follows:
+1 for upward movement (when the filtered value is greater than the previous value).
-1 for downward movement (when the filtered value is less than the previous value).
The cumulative result of this loop gives a continuous trend score, which serves as a directional indicator for the market's momentum. By summing the scores over the window period, the loop provides an aggregate value that reflects the overall trend strength. This score helps determine whether the market is experiencing a strong uptrend, downtrend, or sideways movement.
3. Long and Short Conditions:
Once the trend score has been calculated, it is compared against predefined threshold levels:
A long signal is generated when the trend score exceeds the upper threshold, indicating that the market is in a strong uptrend.
A short signal is generated when the trend score crosses below the lower threshold, signaling a potential downtrend or trend reversal.
These conditions provide clear signals for potential entry points, and the color-coding helps traders quickly identify market direction:
Long signals are displayed in green.
Short signals are displayed in red.
These signals are designed to provide high-confidence entries for trend-following strategies, helping traders capture profitable movements in the market.
4. Trend Background and Bar Coloring:
The script offers customizable visual settings to enhance the clarity of the trend signals. Traders can choose to:
Color the bars based on the trend direction: Bars are colored green for long signals and red for short signals.
Change the background color to provide additional context: The background will be shaded green for a bullish trend and red for a bearish trend. This visual helps traders to stay aligned with the prevailing market sentiment.
These features offer a quick visual reference for understanding the market's direction, making it easier for traders to identify when to enter or exit positions.
5. Threshold Lines for Visual :
Threshold lines are plotted on the chart to represent the predefined long and short levels. These lines act as clear markers for when the market reaches a critical threshold, triggering a potential buy (long) or sell (short) signal. By showing these threshold lines on the chart, traders can quickly gauge the strength of the market and assess whether the trend is strong enough to warrant action.
These thresholds can be adjusted based on the trader's preferences, allowing them to fine-tune the indicator for different market conditions or asset behaviors.
6. Customizable Parameters for Flexibility:
The indicator offers several parameters that can be adjusted to suit individual trading preferences:
Window Period (Bilateral Filter): The window size determines how many past price values are used to calculate the bilateral filter. A larger window increases smoothing, while a smaller window results in more responsive, but noisier, data.
Spatial Sigma (σ_d) and Range Sigma (σ_r): These values control how sensitive the filter is to price changes and the distance between data points. Fine-tuning these parameters allows traders to adjust the degree of noise reduction applied to the price series.
Threshold Levels: The upper and lower thresholds determine when the trend score crosses into long or short territory. These levels can be customized to better match the trader's risk tolerance or asset characteristics.
Visual Settings: Traders can customize the appearance of the chart, including the line width of trend signals, bar colors, and background shading, to make the indicator more readable and aligned with their charting style.
7. Alerts for Trend Reversals:
The indicator includes alert conditions for real-time notifications when the market crosses the defined thresholds. Traders can set alerts to be notified when:
The trend score crosses the long threshold, signaling an uptrend.
The trend score crosses the short threshold, signaling a downtrend.
These alerts provide timely information, allowing traders to take immediate action when the market shows a significant change in direction.
Final Thoughts
The Bilateral Filter For Loop indicator is a robust tool for trend-following traders who wish to reduce market noise and focus on the underlying trend. By applying the bilateral filter and calculating trend scores, this indicator helps traders identify strong uptrends and downtrends, providing reliable entry signals with minimal market noise. The customizable parameters, visual , and alerting system make it a versatile tool for traders seeking to improve their timing and capture profitable market movements.
Thus following all of the key points here are some sample backtests on the 1D Chart
Disclaimer: Backtests are based off past results, and are not indicative of the future.
INDEX:BTCUSD
INDEX:ETHUSD
CRYPTO:SOLUSD
