BTC_News_2025Library "BTC_News_2025"
This library contains the tooltips used in the script "Bitcoin History Events (BTC Story)"
V1 News from January to May
tt_020125()
tt_070125()
tt_200125()
tt_270125()
tt_300125()
tt_030225()
tt_260225()
tt_240225()
tt_020325()
tt_030325()
tt_090325()
tt_110325()
tt_190325()
tt_280325()
tt_310325()
tt_020425()
tt_060425()
tt_090425()
tt_150425()
tt_190425()
tt_220425()
tt_050525()
tt_080525()
tt_130525()
tt_200525()
tt_220525()
Indicadores y estrategias
Consecutive Candle CounterConsecutive Condition Counter is a versatile indicator that tracks and visualizes consecutive candles based on -defined market conditions. It helps traders quickly identify streaks of bullish or bearish signals by counting how many bars in a row satisfy the selected condition.
🔍 Features:
Three selectable conditions via a dropdown:
Up & Down Days: Counts consecutive up or down candles. Each up candle adds +1, each down candle subtracts -1. The counter resets when direction changes.
RSI Signal: Counts how many consecutive bars RSI remains above 70 (+1 per bar) or below 30 (-1 per bar). Resets when RSI moves back to the neutral zone.
SMA Positioning: Counts consecutive bars where price stays above (+1) or below (-1) a Simple Moving Average (SMA). SMA period is -defined.
📊 Visualization:
Positive streaks are shown in green, negative streaks in red, and neutral values in gray.
Displayed as a histogram below the chart for quick pattern recognition.
⚙️ Inputs:
Choose condition logic from the dropdown.
Configure the RSI period and SMA period as needed.
This tool can be helpful for identifying momentum streaks, overbought/oversold trends, or trend-following behavior in a visually intuitive way.

ADX mura visionOverview
The Enhanced ADX with Custom 40/60 Levels is a Pine Script™ v6 open-source indicator that builds on the classic Average Directional Index by adding two critical thresholds at 40 and 60. These extra levels give you early warning of trend exhaustion and precise exit signals when paired with the mura indicator.
Key Features & Originality
Custom Thresholds (40/60): Beyond the standard ADX levels (25/50), levels at 40 and 60 mark advanced trend strength phases and highlight when momentum is beginning to fade.
Trend Weakness Alerts: Configurable alerts trigger when ADX dips below 60 or 40, signaling ideal exit opportunities before a full reversal.
Color-Coded ADX Line: The ADX line dynamically changes color upon crossing 40 and 60, making trend strength transitions instantly visible.
mura Indicator Synergy: Specially designed to complement the mura indicator—when mura signals an exit and ADX falls below your chosen threshold, you get a high-confidence cue to close your position.
How It Works
Advanced Trend Phases: ADX above 25 confirms a trend, above 40 indicates strong momentum, and above 60 signals extreme strength. A drop below 60 or 40 warns of weakening momentum.
Exit Confirmation: Combine a mura exit signal (e.g., dot flip or reversal) with an ADX cross below 40/60 to capture optimal exit points.
Usage & Inputs
ADX Length (default 14): Period for ADX calculation.
Level Inputs: Customize your threshold levels (default: 25, 40, 50, 60).
Alert Toggles: Enable alerts on crosses above or below each level.
Style Settings: Adjust line colors and widths for ADX and threshold lines.
Why This Adds Value
Early Exit Signals: Identify momentum loss before major reversals, protecting profits.
Cleaner Trade Management: Visual cues reduce guesswork when exiting trades.
Modular Design: Use standalone or integrate with mura for robust entry/exit workflows.
Pine Script™ Version: v6
Open-Source License: MPL-2.0

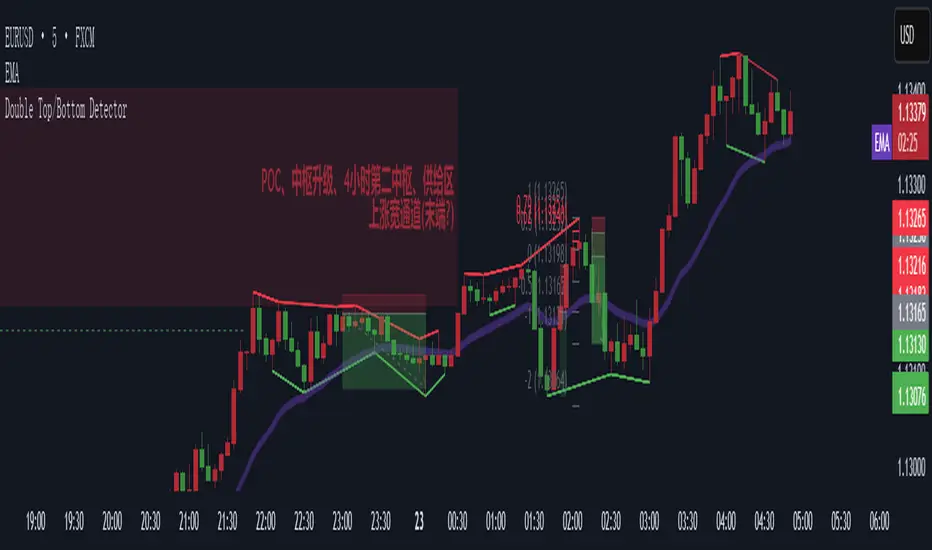
Double Top/Bottom DetectorDouble Top/Bottom Detector Indicator Description
Overview
The Double Top/Bottom Detector is a technical analysis tool designed to automatically identify and label potential double top and double bottom patterns on price charts. By combining pivot point detection with configurable height tolerance and pullback depth criteria, this indicator helps traders visually spot possible trend reversal zones without manual drawing or guesswork.
Key Features
• Pivot Point Identification
The indicator uses a symmetric window approach to find true highs and lows. A pivot high is confirmed only when a bar’s high exceeds the highs of a specified number of bars both before and after it. Likewise, a pivot low is established when a bar’s low is the lowest in its surrounding window.
• Double Top and Double Bottom Detection
– Height Tolerance: Ensures that the two pivot points forming the pattern are within a -defined percentage of each other.
– Pullback Depth: Measures the drop (for a double top) or the rise (for a double bottom) between the two pivot points and confirms that it meets a minimum percentage threshold.
• Automatic Drawing and Labeling
When a valid double top is detected, a red line connects the two pivot highs and a “Double Top” label is centered above the line. For a double bottom, a green line connects the two pivot lows and a “Double Bottom” label appears below the midpoint.
• Pivot Visualization for Debugging
Small red and green triangles mark every detected pivot high and pivot low on the chart, making it easy to and fine-tune settings.
Parameters
Height Tolerance (%) – The maximum allowable percentage difference between the two pivot heights (default 2.0).
Pullback Minimum (%) – The minimum required percentage pullback (for tops) or rebound (for bottoms) between the two pivots (default 5.0).
Pivot Lookback – The number of bars to look back and forward for validating pivot points (default 5).
Window Length – The number of bars over which to compute pullback extrema, equal to twice the pivot lookback plus one (default derived from pivot lookback).
Usage Instructions
1. Copy the Pine Script code into TradingView’s editor and select version 6.
2. Adjust the parameters based on the asset’s volatility and timeframe. A larger lookback window yields fewer but more reliable pivots; tighter height tolerance produces more precise pattern matches.
3. Observe the chart for red and green triangles marking pivot highs and lows. When two qualifying pivots occur, the indicator draws a connecting line and displays a descriptive label.
4. To extend the number of visible historical lines and labels, increase the max\_lines\_count and max\_labels\_count settings in the indicator declaration.
Customization Ideas
• Add volume or moving average filters to reduce false signals.
• Encapsulate pivot logic into reusable functions for cleaner code.
• Incorporate alert conditions to receive notifications when new double top or bottom patterns form.
This indicator is well suited for medium- to long-term analysis and can be combined with risk management rules to enhance decision making.
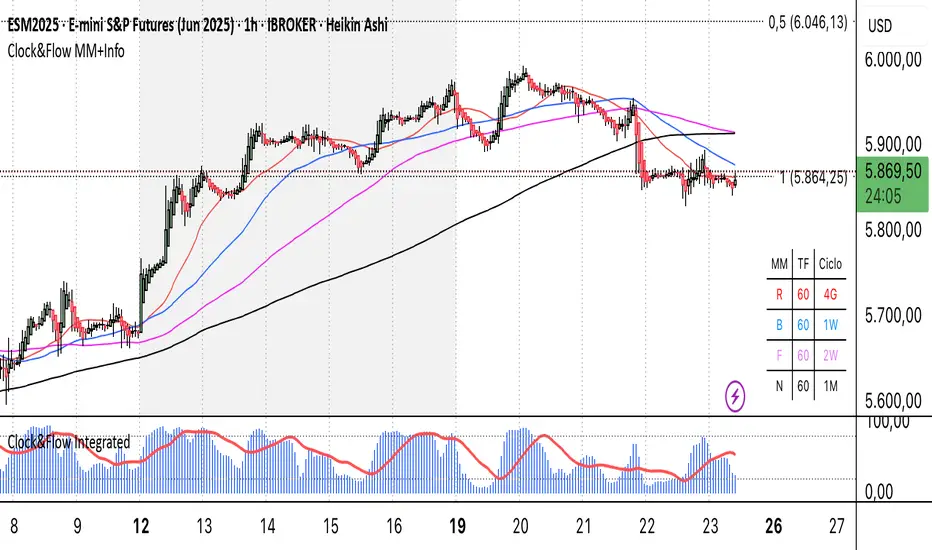
Clock&Flow MM+InfoThis script is an indicator that helps you visualize various moving averages directly on the price chart and gain some additional insights.
Here's what it essentially does:
Displays Different Moving Averages: You can choose to see groups of moving averages with different periods, set to nominal cyclical durations. You can also opt to configure them for instruments traded with classic or extended trading hours (great for Futures), and they'll adapt to your chosen timeframe.
Colored Bands: It allows you to add colored bands to the background of the chart that change weekly or daily, helping you visualize time cycles. You can customize the band colors.
Information Table: A small table appears in a corner of the chart, indicating which cycle the moving averages belong to (daily, weekly, monthly, etc.), corresponding to the timeframe you are using on the chart.
Customization: You can easily enable or disable the various groups of moving averages or the colored bands through the indicator's settings.
It's a useful tool for traders who use moving averages to identify trends and /resistance levels, and who want a quick overview of market cycles.
Questo script è un indicatore che aiuta a visualizzare diverse medie mobili direttamente sul grafico dei prezzi e a ottenere alcune informazioni aggiuntive.
In pratica, fa queste cose:
Mostra diverse medie mobili: Puoi scegliere di vedere gruppi di medie mobili con periodi diversi impostati sulle durate cicliche nominali. Puoi scegliere se impostarle per uno strumento quotato con orario di negoziazione classico o esteso (ottimo per i Futures) e si adattano al tuo timeframe).
Bande colorate: Ti permette di aggiungere delle bande colorate sullo sfondo del grafico che cambiano ogni settimana o ogni giorno, per aiutarti a visualizzare i cicli temporali. Puoi scegliere il colore delle bande.
Tabella informativa: In un angolo del grafico, compare una piccola tabella che indica a quale ciclo appartengono le medie mobili (giornaliero, settimanale, mensile, ecc.) e corrispondono in base al timeframe che stai usando sul grafico.
Personalizzazione: Puoi facilmente attivare o disattivare i vari gruppi di medie mobili o le bande colorate tramite le impostazioni dell'indicatore.
È uno strumento utile per i trader che usano le medie mobili per identificare trend e i/resistenze, e che vogliono avere un colpo d'occhio sui cicli di mercato.
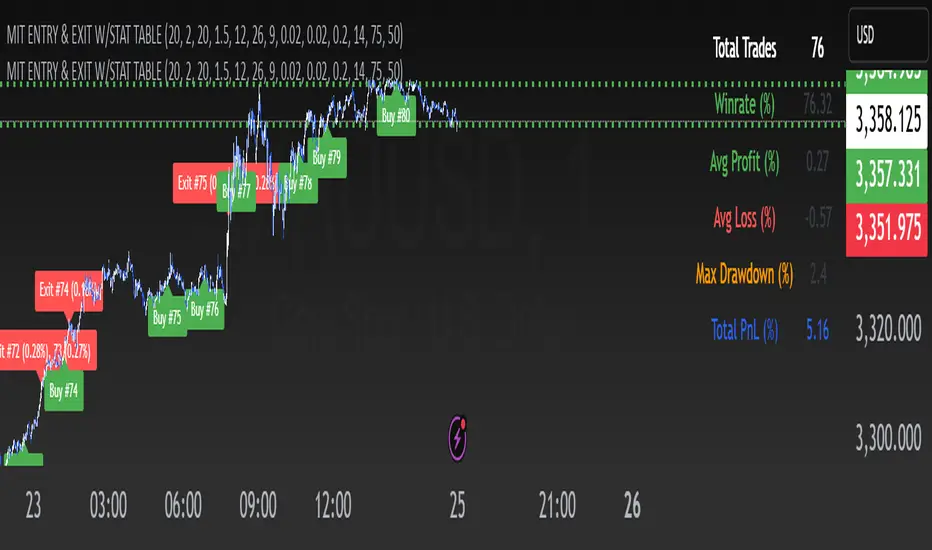
Volume and Volatility Ratio Indicator-WODI策略名称
交易量与波动率比例策略-WODI
一、用户自定义参数
vol_length:交易量均线长度,计算基础交易量活跃度。
index_short_length / index_long_length:指数短期与长期均线长度,用于捕捉中短期与中长期趋势。
index_magnification:敏感度放大倍数,调整指数均线的灵敏度。
index_threshold_magnification:阈值放大因子,用于动态过滤噪音。
lookback_bars:形态检测回溯K线根数,用于捕捉反转模式。
fib_tp_ratio / fib_sl_ratio:斐波那契止盈与止损比率,分别对应黄金分割(0.618/0.382 等)级别。
enable_reversal:反转信号开关,开启后将原有做空信号反向为做多信号,用于单边趋势加仓。
二、核心计算逻辑
交易量百分比
使用 ta.sma 计算 vol_ma,并得到 vol_percent = volume / vol_ma * 100。
价格波动率
volatility = (high – low) / close * 100。
构建复合指数
volatility_index = vol_percent * volatility,并分别计算其短期与长期均线(乘以 index_magnification)。
动态阈值
index_threshold = index_long_ma * index_threshold_magnification,过滤常规波动。
三、信号生成与策略执行
做多/做空信号
当短期指数均线自下而上突破长期均线,且 volatility_index 突破 index_threshold 时,发出做多信号。
当短期指数均线自上而下跌破长期均线,且 volatility_index 跌破 index_threshold 时,发出做空信号。
反转信号模式(可选)
若 enable_reversal = true,则所有做空信号反向为做多,用于在强趋势行情中加仓。
止盈止损管理
进场后自动设置斐波那契止盈位(基于入场价 × fib_tp_ratio)和止损位(入场价 × fib_sl_ratio)。
支持多级止盈:可依次以 0.382、0.618 等黄金分割比率分批平仓。
四、图表展示
策略信号标记:图上用箭头标明每次做多/做空(或反转加仓)信号。
斐波那契区间:在K线图中显示止盈/止损水平线。
复合指数与阈值线:与原版相同,在独立窗口绘制短、长期指数均线、指数曲线及阈值。
量能柱状:高于均线时染色,反转模式时额外高亮。
Strategy Name
Volume and Volatility Ratio Strategy – WODI
1. -Defined Parameters
vol_length: Length for volume SMA.
index_short_length / index_long_length: Short and long MA lengths for the composite index.
index_magnification: Sensitivity multiplier for index MAs.
index_threshold_magnification: Threshold multiplier to filter noise.
lookback_bars: Number of bars to look back for pattern detection.
fib_tp_ratio / fib_sl_ratio: Fibonacci take-profit and stop-loss ratios (e.g. 0.618, 0.382).
enable_reversal: Toggle for reversal mode; flips short signals to long for trend-following add-on entries.
2. Core Calculation
Volume Percentage:
vol_ma = ta.sma(volume, vol_length)
vol_percent = volume / vol_ma * 100
Volatility:
volatility = (high – low) / close * 100
Composite Index:
volatility_index = vol_percent * volatility
Short/long MAs applied and scaled by index_magnification.
Dynamic Threshold:
index_threshold = index_long_ma * index_threshold_magnification.
3. Signal Generation & Execution
Long/Short Entries:
Long when short MA crosses above long MA and volatility_index > index_threshold.
Short when short MA crosses below long MA and volatility_index < index_threshold.
Reversal Mode (optional):
If enable_reversal is on, invert all short entries to long to scale into trending moves.
Fibonacci Take-Profit & Stop-Loss:
Automatically set TP/SL levels at entry price × respective Fibonacci ratios.
s multi-stage exits at 0.382, 0.618, etc.
4. Visualization
Signal Arrows: Marks every long/short or reversal-add signal on the chart.
Fibonacci Zones: Plots TP/SL lines on the price .
Index & Threshold: Same as v1.0, with MAs, index curve, and threshold in a separate sub-window.
Volume Bars: Colored when above vol_ma; extra highlight if a reversal-add signal triggers

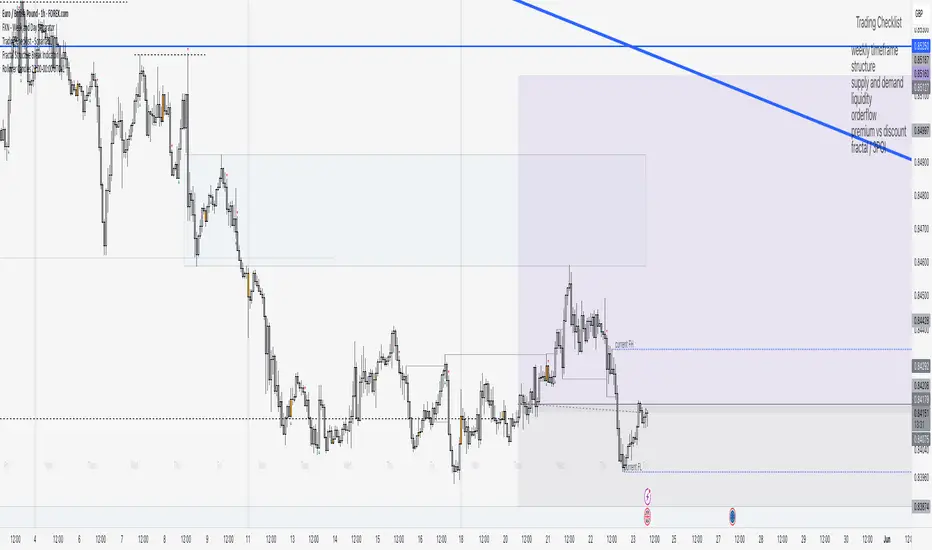
Rollover Candles 23:00-00:00 UTC+1This indicator highlights the Forex Market Rollover candles during which the spreads get very high and some 'fake price action' occurs. By marking them orange you always know you are dealing with a rollover candle and these wicks/candles usually get taken out later on because there are no orders in these candles.
Optimal settings: The rollover takes only 1 hour, so put the visibility of the indicator on the 1 hour time frame and below (or just the 1h).
HTF High/Low Targets This script plots the previous Highs and Lows of the 1HR, 4HR, Daily, and Weekly timeframes.
Each level is color-coded, extends across the chart, and includes labels to help you spot key areas of past and resistance.
Use this tool to:
- Confirm intraday price reactions at HTF zones
- Identify high-probability reversal or breakout areas
- Get notified with built-in alerts when price crosses a level
You can toggle each timeframe level on/off in the settings .
Great for:
- Day traders and scalpers who trade off 1-minute or 5-minute charts
-Swing traders looking for confluence with HTF zones
- Anyone using a multi-timeframe analysis approach
Created by @mychaellesliemedia.

Supertrend with Volume Filter AlertSupertrend with Volume Filter Alert - Indicator Overview
What is the Supertrend Indicator?
The Supertrend indicator is a popular trend-following tool used by traders to identify the direction of the market and potential entry/exit points. It is based on the Average True Range (ATR), which measures volatility, and plots a line on the chart that acts as a dynamic or resistance level. When the price is above the Supertrend line, it signals an uptrend (bullish), and when the price is below, it indicates a downtrend (bearish). The indicator is particularly effective in trending markets but can generate false signals during choppy or sideways conditions.
How This Script Works
The "Supertrend with Volume Filter Alert" enhances the classic Supertrend indicator by adding a customizable volume filter to improve signal reliability.
Here's how it functions:
Supertrend Calculation:The Supertrend is calculated using the ATR over a -defined period (default: 55) and a multiplier (default: 1.85). These parameters control the sensitivity of the indicator:A higher ATR period smooths out volatility, making the indicator less reactive to short-term price fluctuations.The multiplier determines the distance of the Supertrend line from the price, affecting how quickly it responds to trend changes.The script plots the Supertrend line in cyan for uptrends and red for downtrends, making it easy to visualize the market direction.
Volume Filter:A key feature of this script is the volume filter, which helps filter out false signals in choppy markets. The filter compares the current volume to the average volume over a lookback period (default: 20) and only triggers signals if the volume exceeds the average by a specified multiplier (default: 2.0).This ensures that trend changes are accompanied by significant market participation, increasing the likelihood of a genuine trend shift.
Signals and Alerts:
Buy signals (cyan triangle below the bar) are generated when the price crosses above the Supertrend line (indicating an uptrend) and the volume condition is met.Sell signals (red triangle above the bar) are generated when the price crosses below the Supertrend line (indicating a downtrend) and the volume condition is met.Alerts are set up for both buy and sell signals, notifying traders only when the volume filter confirms the trend change.
Customizable Settings for Multiple Markets
The default settings in this script (ATR Period: 55, ATR Multiplier: 1.85, Volume Lookback Period: 20, Volume Multiplier: 2.0) were carefully chosen to provide a balance of sensitivity and reliability across various markets, including stocks, indices (like the S&P 500), forex, and cryptocurrencies.
Here's why these settings work well:
ATR Period (55): A longer ATR period smooths out volatility, making the indicator less prone to whipsaws in volatile markets like crypto or forex, while still being responsive enough for trending markets like indices.
ATR Multiplier (1.85): This multiplier strikes a balance between capturing early trend changes and avoiding noise. A smaller multiplier would make the indicator too sensitive, while a larger one might miss early opportunities.
Volume Lookback Period (20): A 20-bar lookback for volume averaging provides a robust baseline for identifying significant volume spikes, adaptable to both short-term (e.g., daily charts) and longer-term (e.g., weekly charts) timeframes.
Volume Multiplier (2.0): Requiring volume to be at least 2x the average ensures that only high-conviction moves trigger signals, which is crucial for markets with varying liquidity levels.
These parameters are fully customizable, allowing traders to adjust the indicator to their specific market, timeframe, or trading style. For example, you might reduce the ATR period for faster-moving markets or increase the volume multiplier for more conservative signal filtering.
How the Volume Filter Reduces Bad Trades in Choppy Markets
One of the main drawbacks of the Supertrend indicator is its tendency to generate false signals during choppy or ranging markets, where price fluctuates without a clear trend. The volume filter in this script addresses this issue by ensuring that trend changes are backed by significant market activity:
In choppy markets, price movements often lack strong volume, leading to false breakouts or reversals. By requiring volume to be a multiple (default: 2x) of the average volume over the lookback period, the script filters out these low-volume, low-conviction moves.This reduces the likelihood of taking bad trades during sideways markets, as only trend changes with strong volume confirmation will trigger signals. For example, on a daily chart of the S&P 500, a buy signal will only fire if the price crosses above the Supertrend line and the volume on that day is at least twice the 20-day average, indicating genuine buying pressure.
Usage Tips
Markets and Timeframes: This indicator is versatile and can be used on various assets (stocks, indices, forex, crypto) and timeframes (1-minute, 1-hour, daily, etc.). Adjust the settings based on the market's volatility and your trading strategy.
Combine with Other Indicators: While the volume filter improves reliability, consider using additional indicators like RSI or MACD to confirm trends, especially in ranging markets.
Backtesting: Test the indicator on historical data for your chosen market to optimize the settings and ensure they align with your trading goals.
Alerts: Set up alerts for buy and sell signals to stay informed of high-probability trend changes without constantly monitoring the chart.
ConclusionThe "Supertrend with Volume Filter Alert" is a powerful tool for trend-following traders, combining the simplicity of the Supertrend indicator with a volume-based filter to enhance signal accuracy. Its customizable settings make it adaptable to multiple markets, while the volume filter helps reduce false signals in choppy conditions, allowing traders to focus on high-probability trades. Whether you're trading stocks, indices, forex, or crypto, this indicator can help you identify trends with greater confidence.

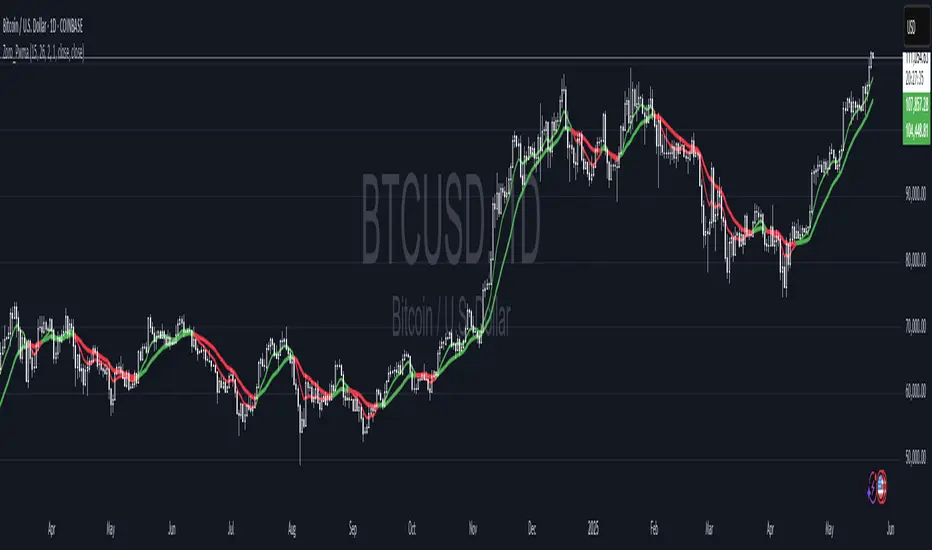
Dual Pwma Trends [ZORO_47]Key Features:
Dual PWMA System: Combines a fast and slow Parabolic Weighted Moving Average to identify momentum shifts and trend changes with precision.
Dynamic Color Coding: The indicator lines change color to reflect market conditions—green for bullish crossovers (potential buy signals) and red for bearish crossunders (potential sell signals), making it easy to interpret at a glance.
Customizable Parameters: Adjust the fast and slow PWMA lengths, power settings, and source data to tailor the indicator to your trading style and timeframe.
Clean Visualization: Plotted with bold, clear lines (3px width) for optimal visibility on any chart, ensuring you never miss a signal.
How It Works:
The indicator calculates two PWMAs using the imported ZOROLIBRARY by ZORO_47. When the fast PWMA crosses above the slow PWMA, both lines turn green, signaling a potential bullish trend. Conversely, when the fast PWMA crosses below the slow PWMA, the lines turn red, indicating a potential bearish trend. The color persists until the next crossover or crossunder, providing a seamless visual cue for trend direction.
Ideal For:
Trend Traders: Identify trend reversals and continuations with clear crossover signals.
Swing Traders: Use on higher timeframes to capture significant price moves.
Day Traders: Fine-tune settings for faster signals on intraday charts.
Settings:
Fast Length/Power: Control the sensitivity of the fast PWMA (default: 12/2).
Slow Length/Power: Adjust the smoother, slower PWMA (default: 21/1).
Source: Choose your preferred data input (default: close price).
Adaptive Multi-TF Indicator Table with Presets giua64📌 Script Name:
Adaptive Multi-Timeframe Indicator Table with Presets — giua64
📄 Description:
This script displays an adaptive multi-timeframe dashboard that summarizes the signals of three key technical indicators:
Moving Averages (MAs), Relative Strength Index (RSI), and MACD.
It provides a fast and visually intuitive overview of market conditions across five timeframes (5m, 15m, 30m, 1h, 4h), helping traders quickly identify potential directional biases (e.g., bullish, bearish, or neutral) based on either predefined presets or fully manual settings.
🧰 Preset Configurations:
You can choose between four trading styles, each with optimized indicator parameters:
Scalping
• MAs: 5 / 10 (Fast), 20 / 50 (Slow)
• RSI: 7 periods | Overbought: 70 | Oversold: 30
• MACD: 5 / 13 | Signal: 3
Intraday
• MAs: 9 / 21 (Fast), 50 / 100 (Slow)
• RSI: 14 periods | Overbought: 60 | Oversold: 40
• MACD: 12 / 26 | Signal: 9
Swing
• MAs: 10 / 20 (Fast), 50 / 200 (Slow)
• RSI: 14 periods | Overbought: 65 | Oversold: 35
• MACD: 12 / 26 | Signal: 9
Manual
• Full custom control over all indicator settings.
🛠️ All settings can be customized manually from the options , including the exact MA periods, RSI thresholds, and MACD structure.
🧠 How It Works:
For each timeframe, the script evaluates:
MA crossover status (two levels):
The first symbol refers to the crossover of the fast MAs
The second symbol refers to the crossover of the slow MAs
🟢 = Bullish crossover
🔴 = Bearish crossover
➖ = Flat or no clear signal
RSI Direction:
↑ = RSI above upper threshold (potential overbought)
↓ = RSI below lower threshold (potential oversold)
→ = RSI in neutral range
MACD Line vs Signal Line:
↑ = MACD line is above signal line (bullish)
↓ = MACD line is below signal line (bearish)
→ = Flat or neutral signal
Each signal is assigned a numerical score. These are aggregated per timeframe to compute a combined score that reflects the directional bias for that specific time window.
🧠 Adaptive Logic by Asset:
This script is designed to be universally compatible across all asset types — including forex, crypto, stocks, indices, and commodities.
Thanks to its multi-timeframe nature and flexible indicator presets, the script automatically adjusts its behavior based on the asset selected, ensuring relevant analysis without requiring manual recalibration.
🧾 Summary Table Output:
At the bottom of the dashboard, a combined sentiment is displayed for:
3TF → 5m, 15m, 30m
4TF → Adds 1h
5TF → Adds 4h
Each row shows:
Signal → LONG / SHORT / NEUTRAL
Confidence (%) → Based on score aggregation and signal consistency
📌 Customization Options:
Table Position: Left, Right, or Center
Text Size: Small, Normal, or Large
Full Manual Configuration: All MA, RSI, and MACD parameters can be adjusted as needed
⚠️ Disclaimer:
This script is for educational and analytical purposes only.
It does not constitute financial advice or guarantee any trading results.
Always do your own research and apply responsible risk management.

Ultimate Volatility CloudUltimate Volatility Cloud
The Ultimate Volatility Cloud is a powerful and highly customizable indicator designed to help traders visualize market volatility, easily identify trend, and overextended moves in price with adaptive bands. It combines the strengths of the Arnaud Legoux Moving Average, Kaufman's Adaptive Moving Average, ATR Channels, and Standard Deviation bands, offering multiple pre-configured profiles and extensive customization options.
Key Features:
Dynamic Volatility Bands: The indicator plots multiple layers of volatility bands around a central basis line, providing a comprehensive view of price deviation.
Hybrid Band Calculation: Bands are a sophisticated blend of Keltner Channels, KAMA ATR Channels and Standard Deviation, allowing for a nuanced representation of volatility.
Adaptive Smoothing: Bands are smoothed using either Exponential Moving Average (EMA) or Kaufman's Adaptive Moving Average (KAMA) based on the selected profile, ensuring responsiveness tailored to market conditions.
Layered Fills: The cloud uses distinct color fills for different volatility levels, making it easy to visually interpret price action relative to its typical range.
Customizable Color Themes: Choose from a variety of pre-set color themes, including "Rainbow," "Wild," and "Monochrome," or stick with classic options to suit your visual preference.
Optional Basis Line Plots: Display the EMA or KAMA basis lines (used in Keltner Channel calculations) separately on the chart for additional analysis.
Understanding the Profiles:
The indicator comes with several pre-configured "Settings Profiles" that adjust the internal parameters (Keltner Channel/KAMA Channel/Standard Deviation band blend, and band smoothing) to suit different trading styles or market environments.
1. Standard Profile:
Blend: 60% Keltner Channel, 40% Standard Deviation.
Smoothing: EMA smoothing of 3 periods.
Purpose: A balanced, general-purpose profile suitable for a wide range of market conditions. It offers a good blend of trend following and volatility awareness.
2. Responsive Profile:
Blend: 40% Keltner Channel, 60% Standard Deviation.
Smoothing: EMA smoothing of 2 period.
Purpose: Designed for traders who need quick reactions to price changes. The higher Standard Deviation blend and minimal smoothing make it highly sensitive to immediate volatility shifts, ideal for short-term analysis or identifying early moves.
3. Ranging Market Profile:
Blend: 80% KAMA ATR Channel, 20% Standard Deviation.
Smoothing: KAMA smoothing.
Purpose: Optimized for sideways or consolidating markets. By utilizing KAMA-based ATR bands and KAMA for band smoothing, this profile adapts its responsiveness to reduce whipsaws in choppy conditions, providing clearer boundaries for range-bound price action.
4. Trend Following Profile:
Blend: 90% Keltner Channel, 10% Standard Deviation.
Smoothing: EMA smoothing of 5 periods.
Purpose: Tailored for riding strong trends. The heavy emphasis on the Keltner Channel and slightly smoother bands help filter out minor fluctuations, allowing traders to focus on the dominant directional movement.
5. Conservative Profile:
Blend: 65% KAMA ATR Channel, 35% Standard Deviation.
Smoothing: EMA smoothing of 10 periods.
Purpose: Aims to provide more filtered signals and reduce noise. The KAMA basis for the Keltner Channel combined with a longer EMA smoothing period offers a slower, more confirmed view of volatility, suitable for traders seeking higher conviction entries or exits.
Example of the Ranging Market Profile
How to Use:
The volatility cloud can be interpreted in various ways:
Price within the inner bands: May indicate consolidation or a period of lower volatility.
Price pushing into outer bands: Suggests increasing volatility and potential for a strong move.
Price breaking out of extreme outer bands: Can signal significant momentum and the start or continuation of a strong trend.
Cloud expansion/contraction: Visually indicates periods of increasing or decreasing market energy.
Experiment with different profiles and settings to find the combination that best suits your trading strategy and the instruments you trade.

Float, Daily % Change & Short %This TradingView Pine Script displays a compact table on your chart showing four key metrics for any stock:
📊 What It Shows:
Float – Number of publicly available shares, formatted in K/M/B.
Daily % Change – Price change from yesterday’s close to the current price.
Intraday % Change – Price change from today’s open to the current price.
Short Volume % – Estimated short volume as a percentage of total daily volume.
⚙️ How to Use:
Add the script to your TradingView chart.
Choose table size and screen position from the settings .
The values update in real-time on the latest candle only, so they stay out of the way but always visible.
Ideal for momentum traders, short float hunters, and day traders who need quick access to real-time float, price action, and short volume stats.

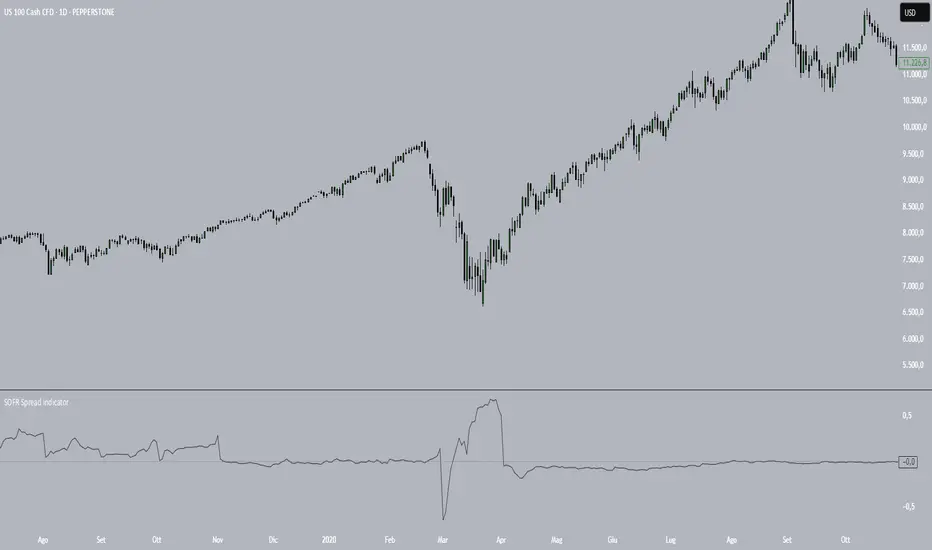
SOFR Spread (proxy: FEDFUNDS - US03MY)📊 SOFR Spread (Proxy: FEDFUNDS - US03MY) – Monitoring USD Money Market Liquidity
In 2008, the spread exhibits a sharp vertical spike, signaling a severe liquidity dislocation: investors rushed into short-term U.S. Treasuries, pushing their yields down dramatically, while the FEDFUNDS rate remained relatively high.
This behavior indicates extreme systemic stress in the interbank lending market, preceding massive Federal Reserve interventions such as rate cuts, emergency liquidity operations, and the launch of quantitative easing (QE).
Description:
This indicator plots the spread between the Effective Federal Funds Rate (FEDFUNDS) and the 3-Month US Treasury Bill yield (US03MY), used here as a proxy for the SOFR spread.
It serves as a simple yet powerful tool to detect liquidity dislocations and stress signals in the US short-term funding markets.
Interpretation:
🔴 Spread > 0.20% → Possible liquidity stress: elevated repo rates, cash shortage, interbank distrust.
🟡 Spread ≈ 0% → Normal market conditions, balanced liquidity.
🟢 Spread < 0% → Excess liquidity: strong demand for T-Bills, “flight to safety”, or distortion due to expansionary monetary policy.
Ideal for:
Monitoring Fed policy impact
Anticipating market-wide liquidity squeezes
Correlation with DXY, SPX, VIX, MOVE Index, and risk sentiment
🧠 Note: As SOFR is not directly available on TradingView, FEDFUNDS is used as a reliable proxy, closely tracking the same trends in most macro conditions.
Linear Volume MACD | Lyro RS📊 Linear Volume MACD | Lyro RS is an advanced momentum and trend detection tool that fuses price action with volume-weighted MACD logic and linear regression analysis . Designed for traders seeking deeper insights into market strength and directional conviction, this indicator highlights trend shifts, volume anomalies, and potential reversal zones with precision.
✨ Key Features :
🔁 Multi-Mode Analysis: Switch between Linear Regression , Strong/Weak Trend , or Volume MACD logic.
📐 Volume-Adjusted MACD: Incorporates volume for a more realistic momentum view.
📊 Linear Regression Signal: Smoother and more reactive trend analysis.
🎯 Dynamic Stdev Bands: Visualize ±1 and ±2 standard deviation thresholds for anomaly detection.
🌈 Custom Color Themes: Choose from built-in palettes or define your own bullish/bearish signal colors.
⚠️ Alert Conditions: Built-in alerts notify you of potential trend shifts across all signal modes.
📈 How It Works :
🧮 MACD Core: Uses volume-weighted price to generate fast and slow EMAs, forming the MACD and signal lines.
📉 Histogram Logic: Histogram is either the traditional MACD histogram or its linear regression version.
📊 Signal Modes:
• Linear Regression: Detect trend based on smoothed MACD behavior.
• Strong/Weak Trend: Identifies accelerating/decelerating trend strength.
• Volume MACD: Classic volume MACD behavior for divergence spotting.
📏 Stdev Bands: Calculated over a long period (default 200) to highlight statistically significant moves.
🎨 Color-coded : Bar and background colors adjust dynamically with market condition.
⚙️ Customization Options :
🔄 Choose your Signal Type from three unique analysis modes.
📏 Modify Fast/Slow/Signal lengths and Regression parameters to suit your strategy.
📈 Enable or disable Stdev Bands and adjust multiplier.
🎨 Select from Classic, Mystic, Accented, or Royal color palettes — or create your own.
📌 Use Cases :
🟢 Identify trend continuation or reversal zones with volume-adjusted signals.
🔴 Detect volatility breakouts using standard deviation bands.
🧭 Use in confluence with price structure, RSI, or market sentiment.
⚠️ Disclaimer :
This indicator is for educational purposes only. It is not financial advice. Always use in conjunction with your own research and risk management strategy.