[Smith] VWAP Deviation + VWAP Deviation +
Short Description:
Advanced VWAP indicator with deviation bands, smart signal filtering, and session-based performance tracking. Features log-space scaling, RSI confirmation, volume filters, and market regime detection.
Full Description:
The VWAP Deviation + is a comprehensive trading indicator that combines Volume Weighted Average Price (VWAP) analysis with advanced signal filtering to identify high-probability trade opportunities. This indicator goes beyond basic VWAP by incorporating multiple confirmation layers and intelligent market analysis.
🎯 Key Features
Core VWAP Analysis:
- Custom volume-weighted mean calculation with deviation bands (2σ and 3σ)
- Optional log-space scaling for proportional price movements
- Real-time VWAP line with customizable visibility
Smart Signal Detection:
- RSI confirmation for all trade signals
- Volume filter requiring above-average trading activity
- Market regime detection (trending vs ranging markets)
- Optional RSI divergence analysis
Advanced Filtering:
- Multi-condition signal validation
- Session-based performance tracking (Asian, London, NY)
- Real-time win rate calculation
- Strong vs regular signal classification
Visual Features:
- Clean, professional interface with customizable colors
- Optional signal shapes and annotations
- Performance statistics table
- Filled deviation bands for easy visualization
📊 How It Works
The indicator identifies trade opportunities when:
1. Price touches VWAP deviation bands (2σ or 3σ)
2. RSI confirms oversold/overbought conditions
3. Volume exceeds the specified threshold
4. Market regime conditions are favorable
Signal Types:
- LONG : Price at lower bands + RSI oversold + volume confirmation
- SHORT : Price at upper bands + RSI overbought + volume confirmation
- STRONG : Same conditions but at 3σ bands for higher conviction trades
⚙️ Customization Options
Core Settings:
- VWAP length and source selection
- Adjustable deviation multipliers
- Log-space scaling toggle
Signal Filters:
- RSI length and threshold levels
- Volume filter with customizable multiplier
- Market type filtering options
Advanced Features:
- Session statistics tracking
- RSI divergence detection
- Market regime analysis
Visual Controls:
- Show/hide individual components
- Custom color schemes
- Signal display toggles
🔔 Alert System
Built-in alerts for:
- Long and short trade opportunities
- Strong signal confirmations
- RSI divergence signals
💡 Best Practices
- Use higher timeframes (15m+) for more reliable signals
- Combine with additional confirmation indicators
- Pay attention to session statistics for timing optimization
- Monitor market regime indicators for context
This indicator is suitable for day traders, swing traders, and anyone looking to improve their VWAP-based trading strategies with advanced filtering and market analysis.
Volatilidad

Flux Capacitor (FC)# Flux Capacitor
**A volume-weighted, outlier-resistant momentum oscillator designed to expose hidden directional pressure from institutional participants.**
---
### Why "Flux Capacitor"?
The name pays homage to the fictional energy core in *Back to the Future* — an invisible engine that powers movement. Similarly, this indicator detects whether price movement is being powered by real market participation (volume) or if it's coasting without conviction.
---
### Methodology
The Flux Capacitor fuses three statistical layers:
- **Normalized Momentum**: `(Close – Open) / ATR`
Controls for raw price size and volatility.
- **Volume Scaling**:
Amplifies the effect of price moves that occur with elevated volume.
- **Robust Normalization**:
- *Winsorization* caps outlier spikes.
- *MAD-Z scoring* normalizes the signal across assets (crypto, futures, stocks).
- This produces consistent scaling across timeframes and symbols.
The result is a smooth oscillator that reliably indicates **liquidity-backed momentum** — not just price movement.
---
### Signal Events
- **Divergence (D)**: Price makes higher highs or lower lows, but Flux does not.
- **Absorption (A)**: Candle shows high volume and small body, while Flux opposes the candle direction — indicates smart money stepping in.
- **Compression (◆)**: High volume with low momentum — potential breakout zone.
- **Zero-Cross**: Indicates directional regime flip.
- **Flux Acceleration**: Histogram shows pressure rate of change.
- **Regime Background**: Color fades with weakening trend conviction.
All signals are color-coded and visually compact for easy pattern recognition.
---
### Interpreting Divergence & Absorption Correctly
Signal strength improves significantly when it appears **in the correct zone**:
#### Divergence:
| Signal | Zone | Meaning | Strength |
|--------|------------|------------------------------------------|--------------|
| Green D | Below 0 | Bullish reversal forming in weakness | **Strong** |
| Green D | Above 0 | Bullish, but less convincing | Moderate |
| Red D | Above 0 | Bearish reversal forming in strength | **Strong** |
| Red D | Below 0 | Bearish continuation — low warning value | Weak |
#### Absorption:
| Signal | Zone | Meaning | Strength |
|--------|------------|-----------------------------------------|--------------|
| Green A | Below 0 | Buyers absorbing panic-selling | **Strong** |
| Green A | Above 0 | continuation | Moderate |
| Red A | Above 0 | Sellers absorbing FOMO buying | **Strong** |
| Red A | Below 0 | Trend continuation — not actionable | Weak |
Look for **absorption or divergence signals in “enemy territory”** for the most actionable entries.
---
### Reducing Visual Footprint
If your chart shows a long line of numbers across the top of the Flux Capacitor pane (e.g. "FC 14 20 9 ... Bottom Right"), it’s due to TradingView’s *status line input display*.
**To fix this**:
Right-click the indicator pane → **Settings** → **Status Line** tab → uncheck “Show Indicator Arguments”.
This frees up vertical space so top-edge signals (like red `D` or yellow `◆`) remain visible and unobstructed.
---
### Features
- Original MAD-Z based momentum design
- True volume-based divergence and absorption logic
- Built-in alerts for all signal types
- Works across timeframes (1-min to weekly)
- Minimalist, responsive layout
- 25+ customizable parameters
- No future leaks, no repainting
---
### Usage Scenarios
- **Trend confirmation**: Flux > 0 confirms bullish trend strength
- **Reversal detection**: Divergence or absorption in opposite territory = high-probability reversal
- **Breakout anticipation**: Compression signal inside range often precedes directional move
- **Momentum shifts**: Watch for zero-crosses + flux acceleration spikes
---
### ⚠ Visual Note for BTC, ETH, Crude Oil & Futures
These high-priced or rapidly accelerating instruments can visually compress any linear oscillator. You may notice the Flux Capacitor’s line appears "flat" or muted on these assets — especially over long lookbacks.
> **This does not affect signal validity.** Divergence, absorption, and compression triggers still fire based on underlying logic — only the line’s amplitude appears reduced due to scaling constraints.
---
### Disclaimer
This indicator is for educational purposes only. It is not trading advice. Past results do not guarantee future performance. Use in combination with your own risk management and analysis.

Squeeze Momentum Long-Only Strategy v5This strategy is a refined long-only version of the popular Squeeze Momentum Indicator by LazyBear, enhanced with modern multi-filter techniques for improved precision and robustness.
📈 Core Idea
The strategy aims to capture explosive upside moves after periods of low volatility ("squeeze") — confirmed by breakout momentum, strong volume, macro trend alignment, and market context. Trades are entered only long, making it suitable for bullish assets or trending environments like crypto.
🔍 How It Works
1. Squeeze Detection
Detects a "squeeze" condition when Bollinger Bands (BB) contract inside Keltner Channels (KC).
A squeeze releases (entry signal) when BB expand outside KC — implying a potential breakout.
text
Copy
Edit
sqzOff → Squeeze released → Price may expand directionally
2. Momentum Filter (Modified Squeeze Histogram)
Uses a custom linear regression-based histogram (val) to gauge price momentum.
Only enters long when:
val > 0 (bullish momentum)
val is rising for two consecutive bars (to avoid false starts)
val exceeds a configurable threshold
3. Volume Filter
Confirms strength of breakout by requiring:
text
Copy
Edit
Current volume > Volume Moving Average × Multiplier
This ensures that breakouts are backed by real participation, reducing weak or manipulated moves.
4. Trend Filter (HTF SMA)
Uses a higher timeframe (e.g., Daily) Simple Moving Average to define trend bias.
Only takes long trades if price is above the selected trend SMA (e.g., 50-period SMA on D timeframe).
Helps avoid countertrend trades during bear phases or consolidations.
5. Volatility Filter
Uses ATR to measure recent volatility.
Filters out periods of low ATR to avoid trading in choppy, compressed markets.
🎯 Entry Conditions (All Must Be True):
Squeeze releases upward (sqzOff)
Momentum (val) is positive and rising (2-bar confirmation)
Momentum exceeds a minimum strength threshold
Volume spikes above average
Price is above HTF trend SMA
ATR is above its moving average (indicating active market)
🏁 Exit Condition
Closes the trade only when val < 0 → Momentum flips bearish.
(Optional extensions like trailing stops or take-profit rules can be added.)
⚙️ Customization Options
Momentum strength threshold
Volume multiplier
ATR length & filter threshold
HTF trend timeframe (e.g., "D", "3D", "W")
Trend SMA length
KC/BB settings for squeeze tuning
📊 Best Use Cases
Crypto (BTC, ETH, altcoins in uptrends)
Equities in trending sectors
Avoid in sideways, illiquid, or heavily news-driven markets
✅ Benefits
High precision due to multi-layered confirmation
Avoids overtrading in poor conditions
Focuses on clean, high-quality breakout trades
Flexible for risk management add-ons

Haven Average Daily RangeOverview
This indicator is an enhanced version of the traditional ADR tool that adapts to intraday price movements. Unlike static ADR levels, this indicator dynamically adjusts its range boundaries based on real-time price action while maintaining the original ADR calculation framework.
Key Features
ADR calculation based on multiple periods (5, 10, and 20 days)
ADR levels displayed with automatic style changes upon range reach
Customizable display settings (color, line style)
Price labels for better visualization
The indicator helps traders assess the instrument's volatility, identify potential reversal zones, and plan daily trading targets.
Suitable for all timeframes up to D1 and any trading instrument.
How It Works
Session Start (UTC+0): Calculates ADR based on historical data and sets initial High/Low levels
Dynamic Phase: Monitors price action and adjusts the opposite boundary (ADR Low or High) when new extremes are reached.
When price creates new Day high price above the opening price, the ADR Low level moves upward proportionally.
When price creates new Day low price below the opening price, the ADR High level moves downward proportionally.
Completion Phase: Stops adjustments and highlights breach when price reaches either boundary
Trading Application
Entry and Exit Signals
The ADR boundaries serve as key decision points for trade execution. When price approaches the upper ADR boundary, it often signals a potential selling zone, particularly when confluence exists with other overbought indicators such as RSI divergence or resistance levels. Conversely, price reaching the lower ADR boundary frequently indicates potential buying opportunities, especially when ed by oversold conditions or confluences.
Trend Continuation Assessment
One of the most valuable applications is gauging the probability of continued directional movement. When the current session's price action has not yet reached either ADR boundary, statistical probability favors trend continuation in the established direction. This information helps traders stay with profitable positions longer rather than exiting prematurely.
Reversal and Consolidation Zones
The visual color change to orange when ADR boundaries are reached provides immediate that the normal daily range has been exhausted. At this point, the probability of trend reversal or sideways consolidation increases significantly. This signal helps traders prepare for potential position adjustments or new counter-trend opportunities.

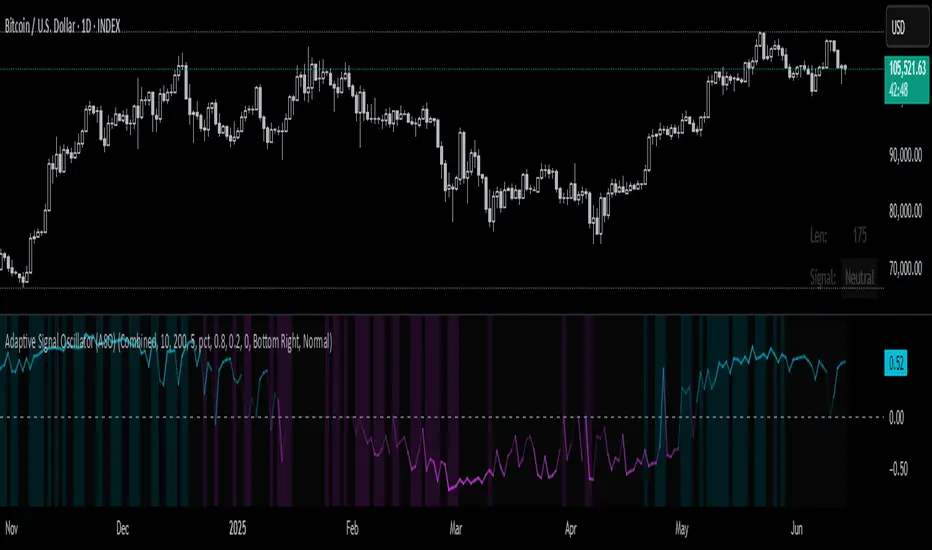
Adaptive Signal Oscillator (ASO)📘 Adaptive Signal Oscillator (ASO)
A fully dynamic, self-calibrating oscillator that adapts to any asset or timeframe by optimizing for real-time signal stability and volatility structure — without relying on static parameters or hardcoded thresholds.
🔍 Overview
The Adaptive Signal Oscillator (ASO) is a next-generation technical analysis tool designed to provide context-aware long/short signals across crypto, equities, or forex markets. Unlike traditional oscillators (RSI, Stochastics, MACD), ASO requires no manual tuning of lookback periods or overbought/oversold zones — it self-optimizes based on current market behavior.
🧠 How It Works
✅ 1. Dynamic Lookback Optimization
ASO evaluates a range of lookback lengths between -defined minLen and maxLen. For each length, it calculates the standard deviation of returns and finds the one with the least volatility change (i.e., the most stable structure). This length is dynamically assigned as bestLen, recalculated on every bar.
✅ 2. Multi-Layer Signal Composition
Four independent signal layers are computed using bestLen:
RSI Layer: Measures relative price strength via a custom dynamic RSI.
Z-Score Layer: Standardized deviation of price from its mean.
Volatility Layer: Standard deviation of log or percent returns.
Price Position Layer: Current price percentile within the lookback window.
Each of these layers is transformed into a percentile score scaled to the range .
✅ 3. Volatility-Based Weighting
The standard deviation (volatility) of each signal layer is computed. Less volatile layers are weighted more heavily, ensuring the final composite signal prioritizes stable, consistent inputs.
Weights are normalized and combined to form a composite score, representing a dynamically blended, noise-weighted signal across the four layers.
✅ 4. Optional Adaptive Smoothing
A boolean toggle lets s apply smoothing to the final score. The smoothing window scales proportionally to bestLen, preserving adaptiveness even during trend transitions.
✅ 5. Percentile-Based Thresholding
Rather than using arbitrary fixed thresholds, ASO converts the composite score into a ranked percentile. Long/short signals are then generated based on -defined percentile bands, adapting naturally to each asset’s behavior.
📈 Interpreting ASO
Score > Threshold → Strong long signal (highlighted in aqua).
Score < Threshold → Strong short signal (highlighted in fuchsia).
Crossing h_thresh (e.g., 0) → Neutral-to-bias change; useful for early trend cues.
The background and label update in real time to reflect the current regime and bestLen.
⚙️ Inputs
minLen, maxLen, step: Define the search range for optimal lookback length.
retMethod: Choose between log or percent return calculations.
threshHigh, threshLow: Define signal zones using percentiles.
smooth: Enable dynamic score smoothing.
h_thresh: Midline crossover zone for directional context.
⚠️ Disclaimer
This tool is designed for exploratory and educational purposes only. It does not offer financial advice or trading recommendations. Past performance is not indicative of future results.
Always consult a licensed financial advisor before making investment decisions.
Squeeze Pro Momentum BAR color - KLTDescription:
The Squeeze Pro Momentum indicator is a powerful tool designed to detect volatility compression ("squeeze" zones) and visualize momentum shifts using a refined color-based system. This script blends the well-known concepts of Bollinger Bands and Keltner Channels with an optimized momentum engine that uses dynamic color gradients to reflect trend strength, direction, and volatility.
It’s built for traders who want early warning of potential breakouts and clearer insight into underlying market momentum.
🔍 How It Works:
📉 Squeeze Detection:
This indicator identifies "squeeze" conditions by comparing Bollinger Bands and Keltner Channels:
When Bollinger Bands are inside Keltner Channels → Squeeze is ON
When Bollinger Bands expand outside Keltner Channels → Squeeze is OFF
You’ll see squeeze zones classified as:
Wide
Normal
Narrow
Each represents varying levels of compression and breakout potential.
⚡ Momentum Engine:
Momentum is calculated using linear regression of the price's deviation from a dynamic average of highs, lows, and closes. This gives a more accurate representation of directional pressure in the market.
🧠 Smart Candle Coloring (Optimized):
The momentum color logic is inspired by machine learning principles (no hardcoded thresholds):
EMA smoothing and rate of change (ROC) are used to detect momentum acceleration.
ATR-based filters help remove noise and false signals.
Colors are dynamically assigned based on both direction and trend strength.
🧪 How to Use It:
Look for Squeeze Conditions — especially narrow squeezes, which tend to precede high-momentum breakouts.
Confirm with Momentum Color — strong colors often indicate trend continuation; fading colors may signal exhaustion.
Combine with Price Action — use this tool with /resistance or patterns for higher probability setups.
Recommended For:
Trend Traders
Breakout Traders
Volatility Strategy s
Anyone who wants visual clarity on trend strength
📌 Tip: This indicator works great when layered with volume and price action patterns. It is fully non-repainting and s overlay on price charts.

🕯️ Full Candle Size AnalyzerFull Candle Size Analyzer – Detect Volatility with Visuals and Alerts
This all-in-one indicator is designed to help traders spot large candles based on high–low range, a key measure of price volatility. It provides a clear visual representation and customizable alerts when candle sizes exceed average behavior.
Features:
🎯 Candle Coloring: Automatically colors candles red if their full size (High - Low) exceeds a -defined multiple of the average candle size.
📊 Size Plotting: Displays both current candle size and its moving average in a separate pane for easy visual comparison (toggle on/off).
🚨 Alerts: Alerts when candle size exceeds a more aggressive threshold (customizable).
🎨 Background Highlights: Light red background flags extremely large candles visually.
⚙️ Customizable Settings: Choose your average period, thresholds for coloring and alerting, and plot visibility.

HOG Liquidity HunterHOG Liquidity Hunter – Pivot‑Based Liquidity Zones
📌 Overview
Plots dynamic and resistance zones on swing pivots with an ATR‑based buffer. Anchored only when pivots are confirmed, the zones stay close to current price levels—ideal for spotting liquidity runs or traps.
🔧 How It Works
Detects swing highs and lows using ta.pivothigh() / ta.pivotlow() with a ‑defined lookback.
After a pivot is confirmed, calculates BSL/SSL zone = pivot ± (ATR * margin).
Zones update only on confirmed pivots—no repainting on open bars.
⚙️ Inputs
Lookback: bars to confirm pivots (e.g. 10–20).
ATR Margin Multiplier: buffer width (e.g. 1.25).
✅ Benefits
Structure‑focused: Zones align with real swing points.
Responsive yet stable: Tight ATR margin keeps zones precise, only updating on valid pivots.
Clean visuals: Two uncluttered zones—easy to interpret.
🛠 How to Use
Detect near‑zone bounce entries or exits on 4H/1D charts.
Combine with trend or volume indicators for stronger setups.
Use zones to identify potential stop‑run, liquidity re‑tests, or range turns.
⚠️ Notes & Disclaimers
Zones base off historical pivots; may lag until confirmed.
No future-looking data—relying entirely on closing bar confirmation.
Use alongside a complete trading framework; this is not a standalone signal.


HOG QQE StackHOG QQE Stack – Advanced Momentum + Volatility “Stack”
🧠 Overview
HOG QQE Stack enhances classic QQE (a smoothed RSI variant) by layering multiple signal validation components: momentum, volatility, color gradient, and volume confirmation. This “stacked” structure produces clearer, more reliable signals than using RSI or QQE alone.
📊 Key Features
1. **Smoothed RSI Core**
Starts from a twice-smoothed RSI base (similar to QQE), reducing noise for cleaner trend detection. :contentReference {index=1}
2. **Fast & Slow Momentum Lines**
Generates dual lines for momentum crossovers—more precise than single-oscillator readings. :contentReference {index=2}
3. **ATR Volatility Filter**
Adds volatility-based bands around the fast line, helping filter out weak moves and false signals. :contentReference {index=3}
4. **Volume‑Validated Pulse Dots**
Pulse dots indicate when strong momentum aligns with volume spikes near overbought/oversold zones—highlighting high-confidence moves.
5. **Gradient Color Line**
The QQE line dynamically colors itself based on its position between OB/OS levels—intuitive and visually insightful.
6. **OB/OS & Midline Context**
Includes fixed 70/50/30 reference lines for quick momentum benchmarking.
7. **Layered Signal Strength**
By stacking momentum, volatility, gradient, and volume, the indicator provides multi-tiered confirmation—hence the “Stack” name.
8. **Repaint-Safe & Minimalist**
Plots only confirmed data—no repainting. The visuals are clean and easy to read.
🎯 Application
- Monitor fast/slow momentum crossovers *within* the volatility band for confirmed trend shifts.
- Use pulse dots to confirm strong movement backed by volume.
- Ideal for 4H/Daily charts, especially when used with HOG Super Trend or Liquidity Hunter.
- OB/OS levels (70/50/30) serve as guides for potential reversals or continuations.
⚙️ Inputs
- RSI Length
- QQE Smooth Factor
- WAE Length & Multiplier
- Overbought & Oversold Levels (default 70/30)
⚠️ Notes
- Designed as a **confirmation stack**, not a standalone strategy.
- No repainting—uses confirmed bar values only.
- Fully original code—no copying.
- No guarantees of performance—use proper risk management.

DAYTRADE GPT StrategyThis is the DAYTRADE GPT Strategy — built for disciplined intraday traders aiming to grow small capital into serious gains through calculated, high-probability trades.
🔍 Strategy Overview:
- Combines Bollinger Bands, RSI, Stochastic RSI, and Volume Spike detection for precise entries.
- Auto-detects optimal LONG and SHORT positions.
- Built-in Stop Loss and Take Profit using a configurable Risk/Reward ratio (default 1:2).
- Includes dynamic trailing stop logic to scale and protect profits once in the green.
🎯 Designed for:
- Scalping and short-term trades on crypto or highly liquid assets.
- Traders who scale positions as profits increase.
- High-frequency setups backed by volume confirmation.
💡 How It Works:
- Long when price is outside lower BB, RSI < 40, Stoch RSI oversold, and volume spike detected.
- Short when price is outside upper BB, RSI > 60, Stoch RSI overbought, and volume spike detected.
- Uses trailing stop once profitable to lock in gains as price climbs.
- Fully customizable: risk ratio, trailing %, and indicator sensitivity.
📈 Goal: Turn consistent setups into strategic wins. Ideal for those growing s from $100 toward $100K by December through disciplined trade management.
Let the algorithm handle entry/exit while you focus on execution. Adjust settings for your market.
#Crypto #DayTrading #Scalping #PineScript #Strategy


HOG Super Trend🔍 HOG Super Trend – Dual‑EMA Trend Confidence
🧠 Overview
Combines two EMAs—Base EMA and Confirmation EMA—to highlight strong trend alignment. Filters trades with price, EMA cross, and slope direction logic.
⚙️ How It Works
• Base EMA (default 34) and Confirmation EMA (default 13)
• Trend flagged only when:
– Price is above/below Base EMA
– Confirmation EMA aligns above/below Base EMA
– Both EMAs are sloping in the same direction
• Colors: Aqua = Bull trend, Red = Bear trend
🎯 Inputs
• Source (price)
• Base EMA Length
• Confirmation EMA Length
✅ Benefits
• Clean trend filter based on alignment and momentum
• No gray—sharp visuals with clear direction cues
• Repaint‑safe—uses confirmed bar data only
📈 Use Cases
• Perfect for trend confirmation on 1H, 4H, or Daily charts
• Use with price action, volume, or structure for precise entries
⚠️ Notes
• Not a standalone signal, but a trend confirmation tool
• No performance guarantees—test with your strategy

UT Bot + Supertrend ComboYour script is a **combined trading indicator** for TradingView that integrates the **UT Bot** and **Supertrend** strategies to generate buy and sell signals for financial markets. Here's a detailed breakdown of its functionality:
---
### **1. Purpose**
The script aims to:
* **Detect buy and sell signals** using the UT Bot and Supertrend strategies.
* **Provide visual indicators** on the chart for easier decision-making.
* **Highlight trends** and issue alerts when significant conditions are met.
---
### **2. Components**
#### **UT Bot**
* **Key Features**:
* Based on the ATR (Average True Range) for calculating dynamic stop-loss levels.
* Option to use **Heikin Ashi candles** for smoother signals.
* Produces buy and sell signals when the price crosses above or below a trailing stop level.
* **Inputs**:
* `ut_key_value`: Sensitivity of the trailing stop (multiplier of the ATR).
* `ut_atr_period`: The period for calculating the ATR.
* `ut_use_heikin_ashi`: A toggle to use Heikin Ashi candles instead of standard candles.
* **Logic**:
* Tracks price movements using ATR and dynamically adjusts stop levels.
* Generates:
* A **buy signal** when the price crosses above the trailing stop.
* A **sell signal** when the price crosses below the trailing stop.
#### **Supertrend**
* **Key Features**:
* Tracks the trend direction based on price and ATR.
* Highlights trends with color shading (green for uptrend, red for downtrend).
* Optional buy and sell signal plotting based on trend reversals.
* **Inputs**:
* `st_atr_period`: The period for ATR calculation.
* `st_multiplier`: Multiplier to determine the distance of the stop levels.
* `st_show_signals`: Toggle to show buy/sell signals.
* `st_highlighting`: Toggle for background trend highlighting.
* **Logic**:
* Tracks upward and downward trends.
* Generates:
* A **buy signal** when the trend shifts to bullish.
* A **sell signal** when the trend shifts to bearish.
---
### **3. Visual Features**
* **Buy and Sell Labels**:
* `UT Buy` and `UT Sell`: Show buy/sell signals based on UT Bot logic.
* `ST Buy` and `ST Sell`: Show buy/sell signals based on Supertrend logic.
* **Background Highlighting**:
* **Green shading** for uptrends in Supertrend.
* **Red shading** for downtrends in Supertrend.
---
### **4. Alerts**
Custom alerts for automation or notifications:
* **UT Bot Alerts**:
* Triggered when a buy or sell signal occurs.
* **Supertrend Alerts**:
* Triggered on trend reversals.
---
### **5. Flexibility**
* Adjust sensitivity and performance through inputs.
* Combine UT Bot and Supertrend for **confirmation-based trading strategies**.
* Enable/disable highlighting or signals for customization.
---
### **Use Cases**
* Ideal for traders looking for automated trend-following signals.
* Works well in **volatile markets** due to ATR's adaptability.
* Can be used to confirm trades by aligning signals from both strategies.
---
Let me know if you need additional modifications or further clarification!

Swing Trend: 200 EMA + ATR (Long Only)🧠 Strategy Concept:
This swing trading strategy is designed specifically for Ethereum (ETH) on timeframes like 4H or Daily, but it is flexible enough to work across other volatile assets or timeframes with some tuning.
The system combines trend confirmation via a 200-period Exponential Moving Average (EMA) with volatility filtering using the Average True Range (ATR). It aims to capture medium-term bullish swings while avoiding weak or sideways markets.
📈 Entry Logic:
A long position is opened only when both of the following conditions are true:
Price is above the 200 EMA
→ This confirms a longer-term uptrend.
Price is also greater than (EMA + ATR × Multiplier)
→ This volatility buffer ensures we only enter after strong directional moves and avoid minor pullbacks or choppy price action.
The ATR multiplier is customizable (default = 1.5).
ATR length defaults to 14 periods.
✅ This double filter helps reduce false positives and ensures that entries happen only in strong bullish momentum.
💡 Exit Logic:
The exit rule is simple:
Close the position when the price crosses below the 200 EMA, indicating a potential trend reversal or weakening trend.
This approach:
Protects gains by exiting early during trend breakdowns.
Avoids unnecessary complexity like static stop-loss or take-profit.
You can manually add SL/TP logic if desired.
⚙️ Strategy Settings:
EMA Length = 200
ATR Length = 14
ATR Multiplier = 1.5
Position Sizing = 10% of equity per trade (adjustable in strategy settings)
📊 Use Case:
Optimized for swing traders who prefer long-only positions in bull markets.
Particularly effective on ETHUSDT, but applicable to BTC, SOL, etc.
Best used during periods of trending market behavior — avoid sideways or range-bound conditions.
🛠️ Customization Tips:
Timeframe: Works best on 4H or 1D charts; avoid low timeframes unless volatility filtering is adjusted.
EMA Length: Increase to 300–400 for more conservative filtering.
ATR Multiplier: Raise to 2–2.5 to reduce frequency of entries and increase selectivity.
Stop-loss / Take-profit: You can add static or trailing SL/TP for tighter risk control if desired.
📌 Strategy Summary:
Feature Setting
Trend Filter 200 EMA
Volatility Gate ATR (×1.5)
Entry Type Long only
Exit Trigger Close < EMA
Style Trend-following Swing Strategy

OBV with MA & Bollinger Bands by Marius1032OBV with MA & Bollinger Bands by Marius1032
This script adds customizable moving averages and Bollinger Bands to the classic OBV (On Balance Volume) indicator. It helps identify volume-driven momentum and trend strength.
Features:
OBV-based trend tracking
Optional smoothing: SMA, EMA, RMA, WMA, VWMA
Optional Bollinger Bands with SMA
Potential Combinations and Trading Strategies:
Breakouts: Look for price breakouts from the Bollinger Bands, and confirm with a rising OBV for an uptrend or falling OBV for a downtrend.
Trend Reversals: When the price touches a Bollinger Band, examine the OBV for divergence. A bullish divergence (price lower low, OBV higher low) near the lower band could signal a reversal.
Volume Confirmation: Use OBV to confirm the strength of the trend indicated by Bollinger Bands. For example, if the BBs indicate an uptrend and OBV is also rising, it reinforces the bullish signal.
1. On-Balance Volume (OBV):
Purpose: OBV is a momentum indicator that uses volume flow to predict price movements.
Calculation: Volume is added on up days and subtracted on down days.
Interpretation: Rising OBV suggests potential upward price movement. Falling OBV suggests potential lower prices.
Divergence: Divergence between OBV and price can signal potential trend reversals.
2. Moving Average (MA):
Purpose: Moving Averages smooth price fluctuations and help identify trends.
Combination with OBV: Pairing OBV with MAs helps confirm trends and identify potential reversals. A crossover of the OBV line and its MA can signal a trend reversal or continuation.
3. Bollinger Bands (BB):
Purpose: BBs measure market volatility and help identify potential breakouts and trend reversals.
Structure: They consist of a moving average (typically 20-period) and two standard deviation bands.
Combination with OBV: Combining BBs with OBV allows for a multifaceted approach to market analysis. For example, a stock hitting the lower BB with a rising OBV could indicate accumulation and a potential upward reversal.
Created by: Marius1032

ATR-Multiple from 50SMAThis indicator provides a nuanced view of price extension by calculating the distance between the current price and its 50-period Simple Moving Average. This distance is not measured in simple percentage but is quantified in multiples of the Average True Range (ATR), offering a volatility-adjusted perspective on how far an asset has moved from its mean.
The primary goal is to help traders identify potentially overextended conditions, which can often precede price consolidation or reversals. As a general guideline, when an asset's price stretches to multiples of 7 ATRs or more above its 50-day SMA, it often enters a zone where significant profit-taking may occur. By visualizing this extension, the indicator can serve as a powerful tool for gauging when to consider taking profits on existing long positions. Furthermore, it can act as a cautionary signal, helping traders avoid initiating new long positions in assets that are already significantly stretched and may be poised for a pullback.
Features
Volatility-Adjusted Extension
Measures the distance from the 50 SMA in of ATR multiples, providing a more standardized way to compare extension across different assets and time periods.
Daily Timeframe Consistency
By default, the indicator uses the daily SMA and ATR for its calculations, regardless of the chart's current timeframe. This ensures a consistent and meaningful measure of extension rooted in the daily trend.
Histogram Visualization
Displays the result as a clear histogram in a separate pane, making it easy to track the extension level over time and identify historical extremes.
Dynamic Color-Coding
The histogram bars are color-coded to visually highlight different levels of extension. The colors shift as the price moves further from the mean, providing an intuitive at-a-glance reading.
Key Threshold Markers
Includes pre-set horizontal lines at the 7 and 10 ATR multiples to clearly mark the zones of potential profit-taking and extreme extension, respectively.
Built-in Alerts
Comes with configurable alert conditions that can notify you when the price reaches the "profit-taking" threshold (7 ATRs) or the "extreme extension" threshold (10 ATRs).
Customization Options
MA & ATR Periods
You can adjust the length for the Simple Moving Average (default 50) and the Average True Range (default 14) to suit your specific analytical needs.
Timeframe Source
A toggle allows you to switch between always calculating using daily data (the default and recommended setting) or using the data from the current chart's timeframe.
Color Display Style
You can choose between a smooth color gradient that transitions elegantly with the extension level or a distinct, step-based color display for a clearer visual separation of the defined zones.
Full Color Scheme Control
Every visual element is fully customizable. You can change the colors for the regular extension, the "get ready," "profit-taking," and "extreme" levels, as well as the horizontal reference lines.

Volatility Quality [Alpha Extract]The Alpha-Extract Volatility Quality (AVQ) Indicator provides traders with deep insights into market volatility by measuring the directional strength of price movements. This sophisticated momentum-based tool helps identify overbought and oversold conditions, offering actionable buy and sell signals based on volatility trends and standard deviation bands.
🔶 CALCULATION
The indicator processes volatility quality data through a series of analytical steps:
Bar Range Calculation: Measures true range (TR) to capture price volatility.
Directional Weighting: Applies directional bias (positive for bullish candles, negative for bearish) to the true range.
VQI Computation: Uses an exponential moving average (EMA) of weighted volatility to derive the Volatility Quality Index (VQI).
vqiRaw = ta.ema(weightedVol, vqiLen)
Smoothing: Applies an additional EMA to smooth the VQI for clearer signals.
Normalization: Optionally normalizes VQI to a -100/+100 scale based on historical highs and lows.
Standard Deviation Bands: Calculates three upper and lower bands using standard deviation multipliers for volatility thresholds.
vqiStdev = ta.stdev(vqiSmoothed, vqiLen)
upperBand1 = vqiSmoothed + (vqiStdev * stdevMultiplier1)
upperBand2 = vqiSmoothed + (vqiStdev * stdevMultiplier2)
upperBand3 = vqiSmoothed + (vqiStdev * stdevMultiplier3)
lowerBand1 = vqiSmoothed - (vqiStdev * stdevMultiplier1)
lowerBand2 = vqiSmoothed - (vqiStdev * stdevMultiplier2)
lowerBand3 = vqiSmoothed - (vqiStdev * stdevMultiplier3)
Signal Generation: Produces overbought/oversold signals when VQI reaches extreme levels (±200 in normalized mode).
Formula:
Bar Range = True Range (TR)
Weighted Volatility = Bar Range × (Close > Open ? 1 : Close < Open ? -1 : 0)
VQI Raw = EMA(Weighted Volatility, VQI Length)
VQI Smoothed = EMA(VQI Raw, Smoothing Length)
VQI Normalized = ((VQI Smoothed - Lowest VQI) / (Highest VQI - Lowest VQI) - 0.5) × 200
Upper Band N = VQI Smoothed + (StdDev(VQI Smoothed, VQI Length) × Multiplier N)
Lower Band N = VQI Smoothed - (StdDev(VQI Smoothed, VQI Length) × Multiplier N)
🔶 DETAILS
Visual Features:
VQI Plot: Displays VQI as a line or histogram (lime for positive, red for negative).
Standard Deviation Bands: Plots three upper and lower bands (teal for upper, grayscale for lower) to indicate volatility thresholds.
Reference Levels: Horizontal lines at 0 (neutral), +100, and -100 (in normalized mode) for context.
Zone Highlighting: Overbought (⋎ above bars) and oversold (⋏ below bars) signals for extreme VQI levels (±200 in normalized mode).
Candle Coloring: Optional candle overlay colored by VQI direction (lime for positive, red for negative).
Interpretation:
VQI ≥ 200 (Normalized): Overbought condition, strong sell signal.
VQI 100–200: High volatility, potential selling opportunity.
VQI 0–100: Neutral bullish momentum.
VQI 0 to -100: Neutral bearish momentum.
VQI -100 to -200: High volatility, strong bearish momentum.
VQI ≤ -200 (Normalized): Oversold condition, strong buy signal.
🔶 EXAMPLES
Overbought Signal Detection: When VQI exceeds 200 (normalized), the indicator flags potential market tops with a red ⋎ symbol.
Example: During strong uptrends, VQI reaching 200 has historically preceded corrections, allowing traders to secure profits.
Oversold Signal Detection: When VQI falls below -200 (normalized), a lime ⋏ symbol highlights potential buying opportunities.
Example: In bearish markets, VQI dropping below -200 has marked reversal points for profitable long entries.
Volatility Trend Tracking: The VQI plot and bands help traders visualize shifts in market momentum.
Example: A rising VQI crossing above zero with widening bands indicates strengthening bullish momentum, guiding traders to hold or enter long positions.
Dynamic /Resistance: Standard deviation bands act as dynamic volatility thresholds during price movements.
Example: Price reversals often occur near the third standard deviation bands, providing reliable entry/exit points during volatile periods.
🔶 SETTINGS
Customization Options:
VQI Length: Adjust the EMA period for VQI calculation (default: 14, range: 1–50).
Smoothing Length: Set the EMA period for smoothing (default: 5, range: 1–50).
Standard Deviation Multipliers: Customize multipliers for bands (defaults: 1.0, 2.0, 3.0).
Normalization: Toggle normalization to -100/+100 scale and adjust lookback period (default: 200, min: 50).
Display Style: Switch between line or histogram plot for VQI.
Candle Overlay: Enable/disable VQI-colored candles (lime for positive, red for negative).
The Alpha-Extract Volatility Quality Indicator empowers traders with a robust tool to navigate market volatility. By combining directional price range analysis with smoothed volatility metrics, it identifies overbought and oversold conditions, offering clear buy and sell signals. The customizable standard deviation bands and optional normalization provide precise context for market conditions, enabling traders to make informed decisions across various market cycles.

Extended Ichimoku + Multi-Horizon MAExtended Ichimoku + Multi-Horizon MA
This script is a customized extension of the Ichimoku Cloud indicator, designed for traders who want deeper insights into trend behavior across multiple timeframes.
📌 Features:
Multiple Donchian-based lines: TK, KJ, Mid, Near, Far, UltraFar, and Horizon lines give layered /resistance levels.
Expanded Senkou Span logic: Combines various Ichimoku components for a smoother forecasted cloud projection.
Balance Line: An aggregate average line for mid-to-long-term equilibrium tracking.
Customizable Moving Averages: MA1 and MA2 can be configured as SMA, EMA, WMA, VWMA, or SMMA with length/offset options.
Crossover signals: Built-in alerts for bullish/bearish MA crossovers.
🧠 Use Case:
Ideal for intraday and swing traders looking to combine classic trend detection with longer-term market structure. The script visually enhances Ichimoku logic with customizable moving averages for trend confirmation and cloud-based analysis.

RSI-MAI spent a lot of time chasing trading methods.
Until I realized that the best method I need to follow is the reality of my own mind.
With faith in the truth, follow the truth in your heart.

ATR % Line from Day LowHow can you make sure that you're not buying a stock that is too extended?
By limiting your buys to within a certain percentage of either the low-of-the-day (LoD) if you're going long, or to the high-of-the-day (HoD) if you're shorting a stock. This script will help you do just that.
Limiting stock purchases to within a certain percentage of the Average True Range (ATR) from the day's low or high is a risk management technique that offers several key benefits:
Risk Control and Position Sizing
By using ATR as a boundary, you're essentially creating a volatility-adjusted buffer. Since ATR measures recent price volatility, this approach prevents you from buying into stocks that have already moved significantly beyond their normal trading range. This helps avoid entering positions when the stock might be overextended and due for a pullback.
Improved Entry Timing
This strategy encourages patience and discipline. Rather than chasing a stock that's already run up substantially from its low, you wait for better entry points. For example, if you set a limit of 50% of ATR from the day's low, you're only buying when the stock hasn't moved more than half its typical daily range from the bottom.
Volatility Awareness
ATR naturally adjusts for each stock's individual volatility characteristics. A high-volatility stock might have an ATR of $2, while a low-volatility stock might have an ATR of $0.50. This approach scales your entry criteria appropriately for each security rather than using arbitrary dollar amounts.
Reduced Emotional Trading
Having a systematic rule removes the temptation to chase momentum or buy at poor technical levels. It forces you to wait for the stock to come back to more reasonable levels relative to its recent trading behavior.
Better Risk-Reward Ratios
By entering closer to the day's low (within your ATR percentage), you're typically getting a better risk-reward setup. Your stop loss (often placed below the day's low) will be tighter, while your potential upside remains intact.
This approach works particularly well for swing traders and those looking to enter positions on pullbacks or during consolidation periods rather than breakout scenarios.
To save valuable real estate on your chart, there's also an option that can give you a compact version of this indicator which will show only the "Current Day's Low/High" and "Target Price". "Target Price" being the price at which your max buy limit is based on the % ATR you choose in settings.

ATR (14) WatermarkThis lightweight overlay displays the ATR (14) value and its percentage of the current price directly on your chart — along with a visual cue (🔴🟡🟢) to indicate volatility levels.
This tool is perfect for traders who want to quickly assess volatility without crowding the chart with lines or indicators.
🔧 Features:
ATR (14) value and percentage of current price
🔴 High, 🟡 Medium, 🟢 Low volatility indicator
Adjustable vertical & horizontal positioning
Fully configurable text size and color
Clean, unobtrusive table watermark overlay
